Most ecommerce brands earn a net profit margin in the single digits to low teens, and a healthy gross margin usually sits between 35% and 55%. But the number that decides whether you can keep growing is contribution margin, the profit left on each order after product, shipping, fulfillment and ad costs. This guide gives you the benchmarks, the math, and the levers that move each margin.
TL;DR
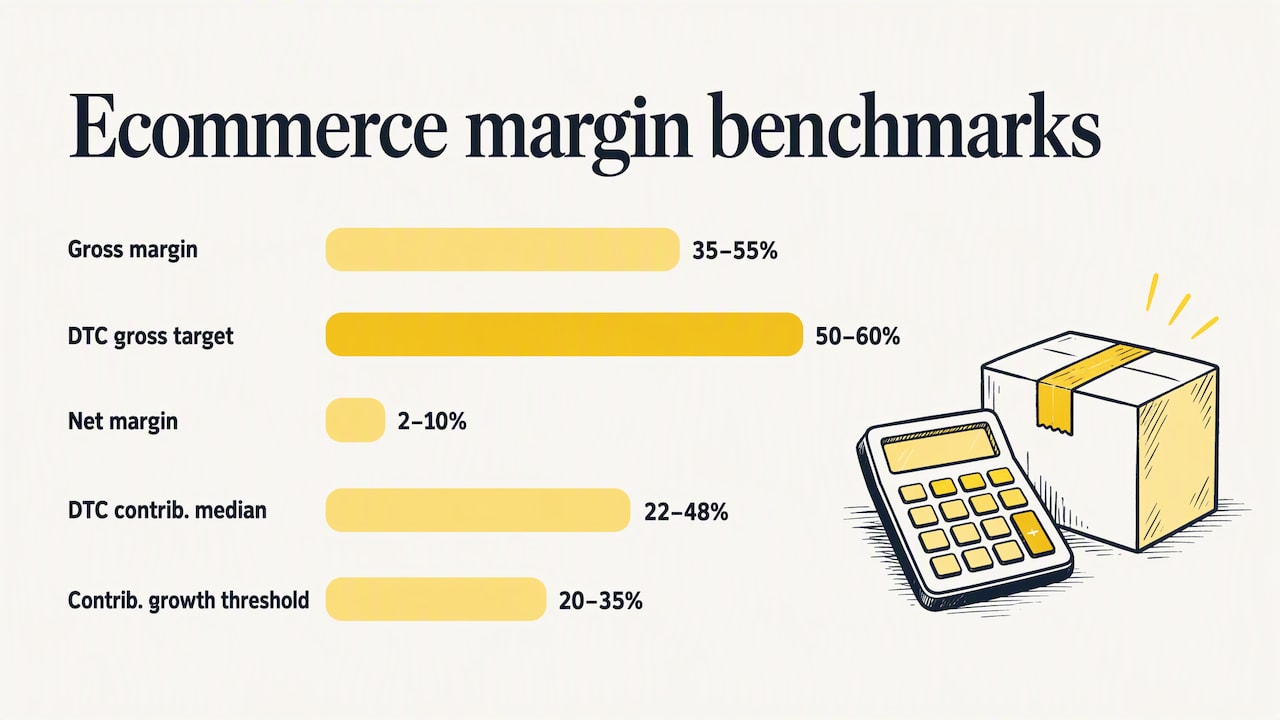
- Gross margin of 35% to 55% is typical for a healthy ecommerce business, while net margins are tight, generally 2% to 10% in that same source.
- Contribution margin is the more useful steering number. Most experts call 20% to 35% healthy for scaling DTC brands, and below 15% makes self-funded growth hard.
- Customer acquisition cost (CAC) is the main margin killer. Retention channels like email and SMS carry the highest margins and can subsidize paid acquisition.
- Benchmark against your own vertical, not a blended average. Apparel and food are very different businesses.
Table of Contents
- Gross, contribution and net margin: what each one tells you
- Average ecommerce profit margins in 2026
- Why margins are under pressure
- A worked example: from gross margin to contribution margin
- Seven levers that improve ecommerce profitability
- How to benchmark your own store
- Our perspective on margin
- Where we can help
- FAQ
- Sources
Gross, contribution and net margin: what each one tells you
Three margins get mixed up constantly, and mixing them up is how brands end up with a great-looking product P&L and an empty bank account.
Gross margin is revenue minus cost of goods sold, divided by revenue. It tells you whether the product is priced well relative to what it costs to make or buy. It ignores almost everything else.
Contribution margin (CM) goes further. It subtracts the variable costs of serving an order: shipping, pick and pack, payment processing, returns and marketing. Many teams split it into levels, for example CM1 after product and fulfillment costs, and CM3 after advertising too. When people say “contribution margin” for a DTC brand, they usually mean the version after ad spend. That is the one that tells you whether another dollar of revenue is worth chasing.
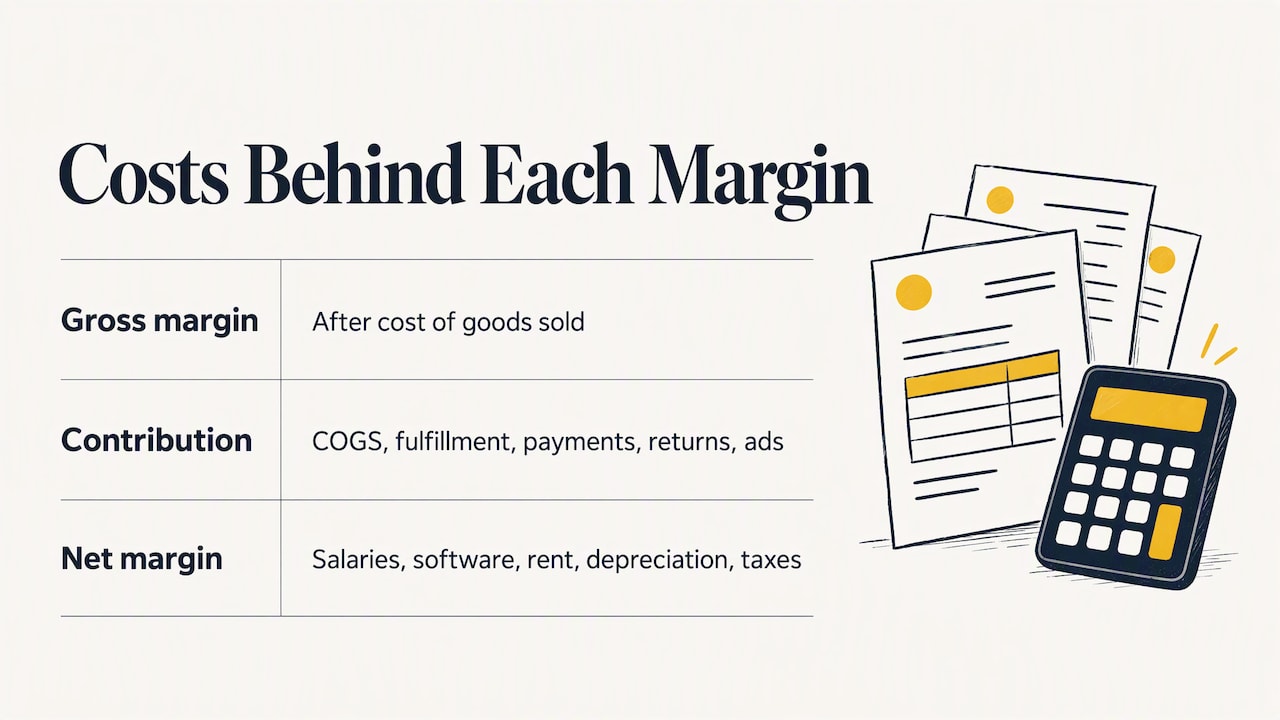
Net margin is what remains after fixed costs too: salaries, software, rent, agency fees, depreciation and taxes. It is the figure your accountant reports and the one that is easiest to hit when contribution margin is healthy and overhead is under control.
The reason to care about the distinction: a strong gross margin does not guarantee a profitable business if fixed costs and CAC are not managed together.
Average ecommerce profit margins in 2026
Benchmarks vary a lot by source, because the datasets differ: public companies, Shopify merchants, venture-backed DTC brands. Treat every number below as a range to sanity-check against, not a target to copy.
| Margin | Typical range | Source |
|---|---|---|
| Gross margin | 35% to 55% | Shopify |
| Gross margin, DTC brands that make their own goods | 50% to 60% targeted | Shopify |
| Net margin | 2% to 10% | Shopify |
| Contribution margin, DTC median | 22% to 48% | APFX benchmarks |
| Contribution margin, sustainable growth threshold | 20% to 35% | Eightx |
A few reasons the figures disagree. Some datasets only include brands that survived and publish results. Others count shipping income differently, or fold marketing into cost of goods. Even for contribution margin, one benchmark of seven- and eight-figure brands puts the median near 25%, with a spread from 3% to 56%. Two brands with identical revenue can be in completely different financial positions.
Public data helps with direction. NYU Stern’s January 2026 dataset lists gross and net margins by industry for US public companies, and shows how far apart verticals are: apparel gross margins are in the high 50s, while general retail is in the low 30s. Those figures include scale advantages that a small or mid-sized online brand rarely has, so use them as context, not as your goal.
Public filings also carry a warning. In one analysis of public DTC and CPG filings, the median public DTC brand ran a negative operating margin in FY2025, after a decade of optimizing for growth over profit.
Why margins are under pressure
Rising acquisition costs
Paid media is the biggest variable cost for most brands, and it keeps getting more expensive as more advertisers compete for the same audiences. Cold acquisition on Meta can often produce a negative contribution margin on the first order. That is not automatically a problem, if the customer comes back. It is a problem if you never measure what happens next.
The payback window matters here. The same research notes that marketplaces often recover CAC within one to three months, while DTC models need six to twelve. A longer window means more cash tied up and more risk if retention is weak.
Returns, discounts and fulfillment
Returns are a quiet drain. The average return rate in online retail is about 19.3%, and in 2026 many brands are choosing to give up some revenue volume to stabilize margins. Discounting works the same way: high discounts have a large effect on profitability and cash, because every point of discount comes straight off gross margin while your ad and shipping costs stay the same.
Fulfillment adds to it. One widely repeated industry figure puts fulfillment at 12% to 20% of ecommerce revenue, though we could not trace it to a primary source, so check your own 3PL invoices rather than rely on it.
The fixed-cost trap
Brands often hit trouble somewhere between $5M and $50M in revenue. Fixed costs for staff, software and space scale faster than revenue, and a common rule of thumb is that every $1 of new fixed cost needs $4 to $5 of incremental revenue to break even, depending on your contribution margin. Hiring ahead of profit is the usual cause.
A worked example: from gross margin to contribution margin
The numbers below are illustrative, not from any client. Say a store sells a $80 product with these per-order costs:
| Line | Per order | Share of revenue |
|---|---|---|
| Revenue | $80.00 | 100% |
| Product cost | $28.00 | 35% |
| Gross profit | $52.00 | 65% |
| Shipping and packaging | $9.00 | 11.25% |
| Payment processing | $2.60 | 3.25% |
| Returns and refunds allowance | $5.00 | 6.25% |
| Contribution after fulfillment (CM1/CM2 style) | $35.40 | 44.25% |
| Blended ad cost per order | $22.00 | 27.5% |
| Contribution after ads (CM3 style) | $13.40 | 16.75% |
A 65% gross margin looks excellent. After ads, the order contributes 16.75%, which is below the 20% to 35% range many experts consider healthy for scaling. Fixed costs still have to come out of that $13.40. Net margin could easily be near zero.
Now change one thing. If 40% of orders come from repeat customers who cost almost nothing to acquire, the blended ad cost per order drops sharply, and the same product suddenly clears the healthy range. That is why the mix of new and returning customers matters as much as the price of the product.
Seven levers that improve ecommerce profitability
- Measure margin at the order and channel level. Blended ROAS hides which campaigns lose money after shipping and returns. Track contribution margin by channel and by first-order versus repeat.
- Fix the offer before buying more traffic. Bundles, higher free-shipping thresholds and fewer sitewide discounts raise average order value without raising CAC.
- Improve conversion rate. A lift in conversion lowers CAC on every channel at once. Landing pages built for a specific ad and audience usually beat sending everything to the homepage.
- Cut avoidable returns. Better size guidance, accurate photos and clearer product pages reduce returns at the source, which is cheaper than processing them.
- Lean on retention. Re-acquiring customers each year to hold growth flat is a failing strategy. Email and SMS flows can reach very high contribution margins, with figures up to 77% cited in the same research, because there is no media cost per message.
- Rebalance paid media. Shift budget toward campaigns and creative that bring in higher-lifetime-value customers, not just cheap first orders. Our write-up on Performance Max for ecommerce covers how to keep Google’s automation pointed at profit.
- Gate fixed-cost hiring. Add headcount when contribution profit supports it, using the $1 of cost to $4 to $5 of revenue rule as a check.
How to benchmark your own store
Start with your vertical. Ranges for beauty, apparel, home goods and food are far apart, so a blended average will mislead you. NYU Stern’s industry table is a decent first reference for gross margin. For contribution margin, use the 20% to 35% range as a guide and treat anything under 15% as a warning light.
Then compare against yourself. Track contribution margin monthly, by channel, and cohort your customers by first purchase month. If the second and third orders from each cohort do not bring contribution back up, acquisition is losing money and discounting is probably papering over it.
Finally, watch CAC payback. If you are a DTC brand and payback is stretching past 12 months, either lower CAC, raise first-order margin, or improve repeat purchase rate. Usually it is a mix of all three.
Our perspective on margin
We work with established Shopify, WooCommerce and Magento brands, and the pattern we see is consistent: brands treat margin as an accounting output rather than a marketing input. The ad account is optimized to ROAS, the email program is an afterthought, and the landing page has not been touched in a year. Each of those decisions quietly sets contribution margin.
That is why we built our Ecommerce Acceleration System™ around three connected levers: acquisition, conversion and retention. Acquisition that ignores conversion buys expensive traffic. Conversion work that ignores retention leaves lifetime value on the table. Retention without acquisition stalls growth. Profit comes from running them as one system, with a target contribution margin agreed up front.
It is also why our work is led by senior strategists and we keep our client roster deliberately small. Margin problems are rarely fixed by a bigger campaign checklist. They are fixed by someone who understands your costs well enough to say no to revenue that does not pay.
— Tom
Where we can help
If your contribution margin is sliding while ad spend rises, the fix usually spans channels. Our paid search and paid social management teams optimize toward contribution profit, not just ROAS, and our Klaviyo setup and optimization work builds the retention flows that carry the highest margins. You can see everything we do on the Rozee Digital homepage.
For more reading, our posts on common Facebook advertising mistakes that raise CAC and subscription email strategy go deeper on two of the levers above.
FAQ
What is a good profit margin for an ecommerce business?
It depends on which margin you mean. A gross margin of 35% to 55% is typical, and DTC brands that make their own products often aim for 50% to 60%. For net margin, 2% to 10% is a common range, and top brands can do better. For contribution margin after ads, aim for 20% or more.
Is a 30% profit margin too high?
At the gross level, 30% is actually low for most DTC brands, since ad costs and fulfillment will consume much of it. As a contribution margin, 30% sits inside the healthy 20% to 35% range. As a net margin, 30% would be exceptional and rare.
Is ecommerce still profitable in 2026?
Yes, but growth is expensive and margins are tighter. US retail ecommerce sales reached $1.23 trillion in 2025, yet margin pressure from CAC and returns is rising. Brands that manage contribution margin and retention tend to stay profitable, while those chasing revenue alone often do not.
What is the difference between gross margin and contribution margin?
Gross margin only subtracts the cost of the product. Contribution margin also subtracts shipping, fulfillment, payment fees, returns and usually advertising. It shows what each order actually leaves you to cover fixed costs and profit.
Sources
- Accounting Ratios: 8 Essential Accounting Ratios for Business (Shopify)
- Ecommerce Data Analytics: A Guide for Enterprise Teams (Shopify)
- Average Ecommerce Profit Margins by Industry 2026 (Eightx)
- The State of DTC Profitability 2026 (Eightx Research)
- Industry-Specific Operations Benchmarks (APFX)
- The margin-true benchmark (Blufire)
- Ecommerce Profit Benchmarks (Finaloop)
- Operating and Net Margins (NYU Stern)
Recommended
- Performance Max Ecommerce Strategy: Stop Wasting Ad Cash
- Ecommerce Facebook Advertising Mistakes Erasing Your Profit
- Ecommerce Google Shopping Ads: Setup to Scale Blueprint
Created with BabyLoveGrowth to get found on Google and AI search