Ecommerce A/B testing means showing two versions of a page, ad, email or offer to randomly split groups of shoppers, then keeping the version that performs better against a metric you set in advance. Done well, it replaces opinion with evidence. Done badly, it produces confident-sounding noise. This guide is for founders and marketing leaders at established DTC and ecommerce brands who want tests that move revenue and margin, not just click-through rate.
TL;DR
- An A/B test compares a control with a variant, splits traffic randomly, and judges both on metrics chosen before launch.
- Pick one primary metric tied to profit (conversion rate, revenue per visitor, AOV) and add guardrail metrics so a “win” does not hurt margin or speed.
- Calculate sample size before you start, run at least one to two weeks, and do not stop the moment a chart looks good.
- Test the high-leverage spots first: product pages, checkout, offers and ad creative. Low-traffic stores should test bigger changes, or use a higher-frequency metric.
- A/B tests tell you what changed in behavior. Customer research tells you why.
Table of Contents
- What ecommerce A/B testing is
- Why test: from conversion lift to profit
- What to test, and where it pays most
- How to plan a test that can be trusted
- Combine experiments with customer research
- Reading results without fooling yourself
- Common mistakes to avoid
- Perspective: test for profit, not for green dashboards
- How Rozee Digital can help
- A simple starting roadmap
- FAQ
- Sources
What ecommerce A/B testing is
A/B testing, also called split testing, compares two versions of a webpage, email or other digital asset and uses real user behavior to decide which performs better. Shopify’s guide to A/B testing describes the mechanics: visitors are randomly divided between versions, data is collected on predefined metrics, and the stronger version can become the new control.
Nielsen Norman Group frames it as a quantitative method that uses live audiences and predetermined business-success metrics. Two words in that definition matter most for an ecommerce operator: live and predetermined. Live means real shoppers with real intent, not a survey. Predetermined means you decide what success is before you see the data, which is what keeps you honest.
The typical elements people test are headlines, images, calls to action, pricing, layouts, product pages and email subject lines. The same logic applies to ads, which we cover separately in our guide to A/B testing ecommerce PPC ads.
Why test: from conversion lift to profit
Adobe’s guidance says experimentation replaces subjective decision-making with controlled, quantitative evidence about how people actually behave. It can also help improve revenue per visitor, average order value, customer lifetime value and purchase frequency.
That last point is where profitable growth lives. A test that raises conversion rate by discounting heavily may look like a win while quietly eroding margin. So before you test anything, get fluent in the metrics that decide whether growth is worth having:
- Conversion rate (CVR): the share of visitors who complete a purchase (or another defined action).
- Average order value (AOV): revenue divided by number of orders.
- Customer acquisition cost (CAC): what you spend in sales and marketing to win one new customer.
- Customer lifetime value (LTV): the revenue or gross profit a customer generates over their relationship with you.
- ROAS (return on ad spend): revenue attributed to an ad channel divided by the spend on that channel.
- MER (marketing efficiency ratio): total revenue divided by total marketing spend across all channels. It avoids the attribution arguments that make ROAS hard to trust on its own.
Statsig’s ecommerce playbook explains why these connect: average order value and purchase frequency determine customer lifetime value, which sets an upper bound on sustainable acquisition cost. In plain terms, every test that lifts AOV or repeat purchases raises the CAC you can afford, which makes paid media easier to scale.
The same playbook suggests treating conversion as the usual primary experiment metric, with AOV and purchase frequency as guardrails, along with page-load time and error rates. We would add one more for most brands: gross margin per order, so a “winner” cannot buy its lift with discounts.
What to test, and where it pays most
Not every element deserves a test. Start where traffic is concentrated and where a shopper is closest to a decision. BigCommerce lists homepage and landing pages, product and category pages, descriptions and imagery, social proof, calls to action and checkout flows as the main ecommerce test areas.
| Area | Example variables | Primary metric to consider | Guardrail to watch |
|---|---|---|---|
| Product page | Image order, video, review placement, shipping information, add-to-cart design | Add-to-cart rate, then purchase conversion | AOV, page speed |
| Checkout | Single-page vs multi-page, form layout, express checkout options | Checkout completion rate | Payment errors, AOV |
| Offers and pricing | Discount framing, free-shipping threshold, bundles | Revenue per visitor | Gross margin, refund rate |
| Landing pages for ads | Headline, hero image, proof, form length | Conversion rate by traffic source | Bounce rate, lead or order quality |
| Email and SMS | Subject line, send time, offer structure | Revenue per recipient | Unsubscribe rate |
| Ad creative | Hook, format, offer, static vs video | Cost per purchase, ROAS | MER, new-customer share |
BigCommerce notes that checkout tests can compare multi-page against single-page checkout, merged steps, form layouts and express checkout options. Checkout changes are often the highest-stakes tests you will run, so give them the most careful sample-size planning.
For creative, the speed of iteration matters. If you are producing many variants of product video, testing AI product video drafts before committing production budget is one way to keep the cost of each test low. Our own performance creative testing framework covers how we think about structuring those tests.
What the research says about ideas
A Wharton meta-analysis looked at 2,732 A/B tests from 252 ecommerce companies across seven industries over three years. Among the practical takeaways: price promotions look worth testing early in the funnel, shipping-related promotions late in the funnel, and design changes to buttons, images, text and layouts are all fair game. Treat these as hypotheses for your own store, not guaranteed outcomes. Your audience, price point and traffic mix decide what works.
How to plan a test that can be trusted
1. Start with a hypothesis
Nielsen Norman Group recommends basing a hypothesis on user research and a clearly defined goal. A useful hypothesis names the change, the audience, the expected effect and the reason. For example (a hypothetical illustration, not a client result):
“Because session recordings suggest mobile shoppers miss our shipping policy, moving delivery times and return terms next to the add-to-cart button will raise mobile add-to-cart rate, without lowering AOV.”
That is specific and falsifiable. “Make the page better” is neither.
2. Choose primary and guardrail metrics
Pick one primary metric. Add guardrails for anything the change could damage: AOV, margin, refund rate, page speed, error rate. Shopify’s current guide lists typical ecommerce goals such as increasing sales, improving add-to-cart rate, reducing cart abandonment, growing email subscriptions and improving click-through rate. Choose the one closest to money you can still measure within a reasonable time.
3. Size the test before you launch
Optimizely’s documentation says sample size should be calculated before the test from the baseline metric value, minimum detectable effect, significance level and variance. Those inputs mean:
- Baseline: your current conversion rate on the page.
- Minimum detectable effect (MDE): the smallest lift worth caring about.
- Significance level: how much false-positive risk you accept (95% is a common choice).
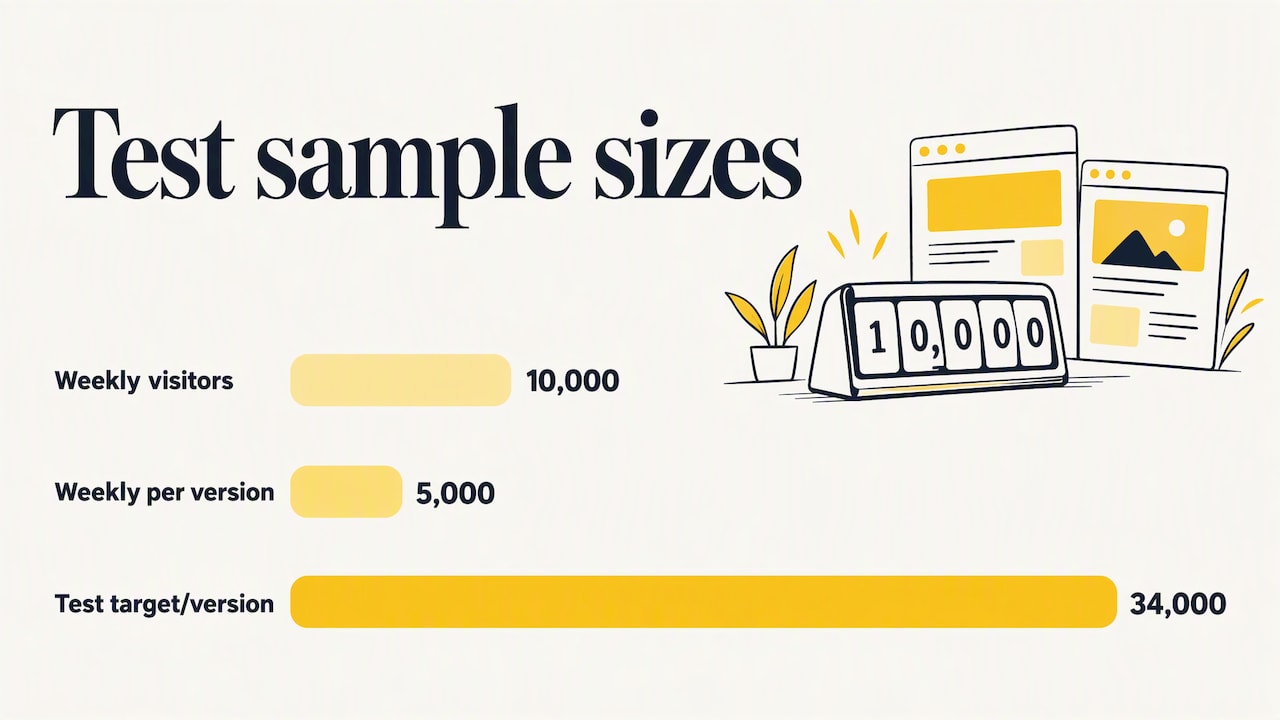
Optimizely’s own worked example uses a 5% baseline, a 10% relative MDE and 95% significance, and arrives at 34,363 visitors per variation. That is a useful reality check. Detecting a small lift on a modest conversion rate takes far more traffic than most people expect.
Here is the practical consequence, as a hypothetical. Say your product page converts at 5% and gets 10,000 visitors a week split across two versions, so 5,000 per version. At roughly 34,000 visitors per variation, you would need about seven weeks to detect a 10% relative lift. If that is too slow, you have two honest choices: test a bolder change with a larger expected effect, or move to a metric that happens more often.
4. Set the duration
Nielsen Norman Group suggests running tests at least one to two weeks to account for behavioral fluctuations. Amazon’s experiment guide adds that results depend on sample size, significance level and duration, and recommends covering both weekdays and weekends and relevant seasonal periods. For a brand with a Black Friday spike, that means a test that straddles a sale period needs careful reading, or should be avoided altogether.
5. Handle low traffic honestly
Shopify’s CRO guidance warns that inadequate sample sizes make results less representative, and lower-traffic stores generally need longer experiments. Optimizely points out that low-frequency purchase events can take longer to reach significance, and that a higher-frequency, directly affected metric such as a banner click can justify serving as the primary metric.
If you go that route, keep purchase conversion and revenue as guardrails so you do not optimize clicks that never become orders.
Combine experiments with customer research
A/B testing tells you whether behavior changed. It does not tell you why. Nielsen Norman Group’s view is that qualitative research is needed to understand the reason, and that combining methods is what researchers call triangulation.
In practice, that means feeding your test backlog from several places: support tickets, post-purchase surveys, session recordings, on-site search terms and checkout drop-off data. A practical read on how small stores can fix checkout, speed and trust issues shows the sort of qualitative problems worth turning into test hypotheses.
Before you commit weeks of traffic to an idea, it also helps to pressure-test an idea cheaply. If the premise fails a quick check, you have saved a test slot for something better.
Reading results without fooling yourself
The discipline is simple to state and hard to follow.
- Wait for the planned sample. Nielsen Norman Group advises tracking primary and guardrail metrics and waiting until the required sample size is reached before drawing conclusions.
- Do not peek and stop. Optimizely notes that precommitting sample size and decision rules prevents mid-test peeking from inflating false positives. Checking daily is fine. Acting on a daily check is not.
- Sort outcomes into three buckets. Win, loss or inconclusive. An inconclusive result is real information: the change did not matter enough to detect, so pick something bolder.
- Ship only what supports the business goal. A statistically significant variant should be implemented if it supports your goals. If it lifts conversion but cuts margin or AOV, keep the control or iterate.
- Record everything. A test log of hypothesis, dates, sample, result and decision stops your team from re-running the same idea a year later.
A worked hypothetical: a variant raises conversion by 6% but AOV drops 9% because it pushes a low-priced bundle. Revenue per visitor falls. Without a guardrail on AOV you would have shipped a loser. This is why the primary metric should sit as close to profit as your data allows.
Common mistakes to avoid
Nielsen Norman Group lists the recurring errors: testing multiple design elements at once without a method that isolates their effects, using too little traffic, stopping early, focusing on a single metric, and ignoring qualitative research and business context. Three more notes from running ecommerce programs:
- Changing many things in one variant. If you redesign a whole page, you may get a win but not know why. NN/G says to change one design element when the goal is causality, and to treat multi-change tests as multivariate testing. A full redesign is a fine bet, just call it a bet.
- Testing during unusual periods. Promotions, stock-outs and holiday traffic change who is visiting. Amazon’s guidance on covering weekdays, weekends and seasonal periods applies in both directions.
- Assuming results transfer across traffic sources. A landing page that wins for email subscribers may lose for cold paid social traffic. Segment the read, but decide the segments in advance.
Stanford’s business school also flags that interference between users on complex two-sided platforms can undermine the isolation simple A/B tests need. For a standard DTC store this is rarely an issue, but it matters if you run a marketplace.
Perspective: test for profit, not for green dashboards
We see the same pattern at many established Shopify, WooCommerce and Magento brands. Testing is treated as a conversion-rate exercise run apart from the ad account and the email program. A page wins, a dashboard turns green, and nobody checks what happened to CAC, margin or repeat purchase.
At Rozee Digital we think about growth as one system: acquisition, conversion and retention. That is the idea behind our Ecommerce Acceleration System™. A test on a landing page is also a test of how efficiently your paid traffic converts. A test on an offer changes the LTV you can plan against, and LTV sets how much you can pay to acquire a customer.
That is why we start with the question “what does this change do to profit?” and only then ask what it does to conversion. Our work is led by senior strategists, and we keep a deliberately small client roster so there is time to build a proper test roadmap rather than run random experiments.
If you take one thing from this guide: pick one profit-linked primary metric, add guardrails, and write down the decision rule before you launch.
Tom
How Rozee Digital can help
If your team has the ideas but not the traffic planning, analysis discipline or senior bandwidth to run a steady testing program, this is the work we do. Rozee Digital supports established ecommerce brands across paid media, conversion-focused landing pages, creative and retention, so tests on a page, an ad or an email flow are read against the same profit picture.

To see how we work, explore our paid social campaign management or look at the full range of services on the Rozee Digital homepage. For more on the conversion side, read our conversion rate optimization strategies and the guide on ecommerce conversion optimization. If you are weighing agency support, the next step is a conversation about your current CAC, retention and testing setup.
A simple starting roadmap
If you are launching a program from scratch, this order tends to work:
- Audit the baseline. Know conversion rate, AOV, CAC, LTV and MER by channel before changing anything.
- Gather qualitative input. Recordings, surveys, support themes.
- Build a backlog. Score ideas by expected impact, confidence and effort, and by whether the page gets enough traffic to test.
- Run one primary test at a time per page. Overlapping tests on the same page muddy the read.
- Review monthly. Check the test log, retire stale ideas and feed learnings into ads and email.
For a wider view of how testing fits into the bigger picture, our guides to increasing conversion rates and measuring ecommerce PPC success are good companions.
FAQ
What is ecommerce A/B testing?
It is a controlled experiment in which shoppers are randomly shown a control or a variant of a page, ad, email or offer. You compare them on predefined metrics, such as conversion rate or revenue per visitor, and keep the stronger version. It works best when the change is single and the success rule is set before launch.
How long should an ecommerce A/B test run?
Run it until you reach the sample size you calculated in advance, and for at least one to two weeks according to Nielsen Norman Group. Include full weekly cycles, and avoid ending a test early because the numbers look good on day three. Low-traffic stores usually need longer.
How much traffic do I need?
It depends on your baseline conversion rate and the smallest lift you want to detect. Optimizely’s example, with a 5% baseline and a 10% relative lift, needs 34,363 visitors per variation. If your traffic is below that, test bolder changes or a higher-frequency primary metric.
What should I A/B test first?
Start where many visitors and purchase intent meet: product pages, checkout, offers and the landing pages that receive your paid traffic. Pick the one with the largest gap between traffic and conversion, and form a hypothesis from customer research rather than taste.
Sources
- Shopify: What Is A/B Testing: How To Do It and Practical Examples
- Shopify: A/B Testing: What It Is and How To Run A/B Tests
- Shopify: 9 Conversion Rate Optimization Mistakes to Avoid
- Nielsen Norman Group: A/B Testing 101
- Adobe: A/B Testing, what it is, examples, and best practices
- Statsig: A/B Testing Playbooks for E-commerce
- Optimizely: Frequentist (Fixed Horizon) statistics
- Optimizely: Why is my experiment failing to reach statistical significance
- Amazon: Manage Your Experiments best practice guide
- BigCommerce: Ecommerce A/B Testing: A Step-By-Step Guide
- Wharton: An Empirical Meta-analysis of E-commerce A/B Testing
- Stanford GSB: Explainer: What is A/B Testing?