Ecommerce advertising is profitable when each order leaves more contribution margin than the ad spend it took to win it, and when you judge that over a window that includes repeat purchases. A dashboard showing 4x ROAS does not tell you that. Break-even math, a clear view of customer acquisition cost (CAC) and a retention-adjusted target do. This guide walks through the math, the channel choices and the levers that move profit for established Shopify, WooCommerce and Magento brands.
Here are the terms we use throughout:
- ROAS (return on ad spend): attributed revenue divided by ad spend. It ignores what the product and the order cost you.
- MER (marketing efficiency ratio): total revenue divided by total marketing spend across all channels. It is a blended, account-level check that does not depend on any one platform’s attribution.
- CAC (customer acquisition cost): what you spend to win one new customer.
- LTV (lifetime value): the revenue or, better, the contribution margin a customer generates over a defined window.
- Contribution margin: revenue minus every variable cost of the order, before ad spend.
TL;DR
- ROAS is not profit. Profit per order is contribution margin minus ad cost, so a high ROAS can sit on top of a losing campaign.
- Break-even ROAS is 1 divided by your gross profit margin. A 40% margin needs 2.5x just to break even.
- Judge new-customer CAC against first-order profit and against 90-day profit once repeat orders are included. Retention lowers the ROAS you need.
- Creative, landing pages and email are profit levers as much as bidding is.
- Rozee Digital works on acquisition, conversion and retention together, led by senior strategists.
Table of Contents
- Why a good ROAS can still lose money
- Step 1: Calculate contribution margin per order
- Step 2: Find your break-even ROAS and maximum CAC
- Step 3: Add retention to the equation
- Step 4: Set a profit floor by product, not one account-wide target
- Step 5: Fix measurement before you trust the numbers
- Where to spend: channel fit by margin and payback
- Creative and landing pages: the levers behind the ROAS
- A weekly profit review for your ad account
- Our perspective
- How Rozee Digital can help
- FAQ
- Sources
Why a good ROAS can still lose money
ROAS divides revenue by ad spend, and revenue is not profit. Amazon Ads makes the point with two advertisers on the same $1,000 spend. According to Amazon Ads’ ads-math guide, an advertiser at 3x ROAS on a 20% margin loses $400, while an advertiser at 2x ROAS on a 60% margin makes $200 in profit. The same guide notes there is no universal “good” ROAS. A good ROAS is the one that is profitable for your margins.
Google’s own documentation frames it the same way. Google Ads Help on ROI defines return on investment as net profit divided by costs. It advises that the value of each conversion should exceed what you paid to get it, and that conversion tracking is how you judge whether a keyword or ad is profitable.
A hypothetical example, labeled as such: a store sells a $100 product with $60 of product cost, shipping, payment fees and pick-and-pack. It spends $10,000 on ads and the platform reports $30,000 in revenue, a 3x ROAS. At a 40% margin that revenue carries $12,000 of contribution. After $10,000 of ads, $2,000 is left to cover everything that is not variable: salaries, software, rent, agency fees. The campaign looks strong in the dashboard and is thin in the bank.
Step 1: Calculate contribution margin per order
Start with the order, not the campaign. Contribution before ads is collected revenue minus every cost that rises with each order. The more complete the list, the more honest your target. Seller Profit Guard’s break-even guide lists nine non-ad costs to include:
- Landed product cost
- Packaging
- Fulfillment
- Marketplace or transaction fees
- Payment processing
- Affiliate or creator commission
- Seller-funded discounts
- App allocation
- Expected return loss
The two that brands most often leave out are discounts and returns. If 10% of orders come back and you cannot resell some of them, that loss belongs in the order’s cost. Shopify’s break-even guide gives the same warning: subtract COGS, shipping, payment fees and pick-and-pack fees, not just the wholesale price.
If contribution before ads is zero or negative, advertising cannot fix it. The same Seller Profit Guard guide says there is no positive paid-acquisition ceiling in that case, and price, cost, offer or product economics have to change first.
Step 2: Find your break-even ROAS and maximum CAC
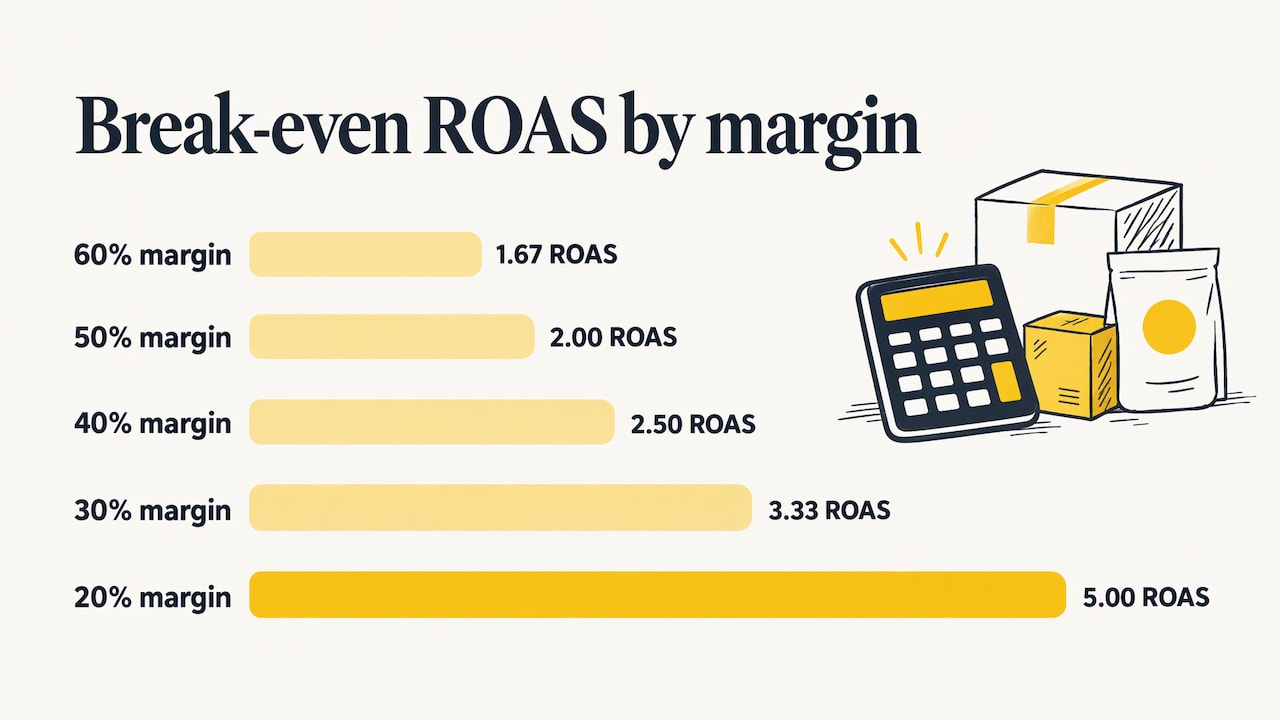
Break-even ROAS is the ROAS at which ad spend equals contribution before ads. Shopify states the formula as 1 divided by gross profit margin. Gross profit margin here is revenue minus variable costs, divided by revenue. For a $100 product with $60 of product cost, shipping and fees, the margin is 40% and break-even ROAS is 2.5.
The table shows how fast the bar rises as margin shrinks (the figures are straight arithmetic from that formula):
| Margin after variable costs | Break-even ROAS | Max ad spend per $100 order at break-even |
|---|---|---|
| 60% | 1.67 | $60 |
| 50% | 2.00 | $50 |
| 40% | 2.50 | $40 |
| 30% | 3.33 | $30 |
| 20% | 5.00 | $20 |
The right column is your first-order break-even CAC if every order came from a new customer. MerchantFlow’s unit-economics documentation defines True CAC as total ad spend across all platforms, including untracked upper-funnel spend, divided by new online customers. It is intentionally higher than the CPA a platform reports. It also says break-even CAC, the average gross profit on a first order, is the number to optimize media bids against. If a platform’s CPA target sits below it, scaling compounds losses.
For a deeper walk-through of the arithmetic, see our guide to the customer acquisition cost formula and our customer acquisition cost examples.
What typical margins mean for your target
Margins vary widely, so benchmark your own rather than copying someone else’s target. For reference, Eightx’s DTC unit-economics analysis reports a median gross margin of 56.6% across 11 public non-food DTC brands, with a middle range of 45.6% to 63.8%. It also reports a median 2024 net profit margin of 3% for seven-figure brands. Its warning is useful: at a 55% gross margin, break-even ROAS runs 2.0x to 3.3x depending on how much ad spend and other variable cost you carry, and at a 40% margin with 20% of revenue in ad spend there is no break-even at all.
Step 3: Add retention to the equation
First-order profit is a strict test. Many brands can afford to acquire customers at a small loss or break-even on the first order if those customers come back. The question is how much they come back, measured on your own cohorts.
Magicianly’s break-even guide has a clear example. With a $100 average order value (AOV) and $55 of first-order contribution, break-even ROAS is 1.82 and break-even CAC is $55. If cohort data shows new customers leave $85 of contribution within 90 days, including repeat purchases, the 90-day break-even ROAS falls to 1.18 and the acquisition ceiling rises to $85. The gap between those two numbers is what retention is worth in paid-media terms.
For repeat-purchase brands, AdAdvisor’s guide to LTV-based optimization gives an LTV-adjusted ROAS floor: break-even ROAS divided by (LTV divided by AOV), using contribution margin and a defined window, commonly 12 months.
Two guardrails keep this honest:
- Use contribution, not revenue, for LTV. Revenue-based LTV overstates how much you can pay.
- Use a short window you can verify. A 90-day cohort you have actually observed beats a 3-year projection you have not.
This is why we treat email and SMS as part of the advertising budget conversation. Every repeat order that comes from a flow rather than a new ad click lowers the ROAS your paid media needs to clear. Our Klaviyo setup and optimisation work is built around that lifetime value and profit link.
Step 4: Set a profit floor by product, not one account-wide target
One blended ROAS target hides a lot. A product at a 65% margin and one at a 25% margin cannot share a floor. Product Metrics’ ecommerce PPC guide defines profit on ad spend (POAS) as contribution before ads divided by ad spend. Since POAS equals ROAS times contribution margin, every break-even ROAS corresponds to a POAS of 1. It recommends setting a floor per product or margin band, grouping products by margin and results, choosing one action per group (increase, keep, lower priority or wait), and waiting out conversion delay before judging a change.
A practical routine looks like this:
- Export order-level data with product cost, discounts, shipping and return rate.
- Group SKUs into three or four margin bands.
- Set a break-even ROAS and a target ROAS for each band, with the target set above break-even to leave room for overhead and profit.
- Review each band weekly on the same rule: scale, hold, deprioritize or wait.
- Check the result against MER and total contribution, not only platform reports.
Marginal returns matter as well. The average ROAS of a campaign can look healthy while the last dollars you added earn far less. Our guide to balancing ad spend and evaluating marginal ROAS covers how to find the point where more budget stops paying.
Step 5: Fix measurement before you trust the numbers
Platform numbers rarely agree, and the gaps are structural. Easy Insights documents that Meta’s default window (7-day click, 1-day view) differs from Google’s last-click or data-driven models and from GA4’s cross-channel model. Its fixes are server-side tagging such as Meta’s Conversions API and server-side Google Tag Manager, consistent UTM conventions, and deduplication by transaction ID.
The practical answer is to use three lenses together:
- Platform reports for in-channel optimization.
- Your store’s own order data for what actually shipped, was paid and was returned.
- MER and new-customer CAC as the blended check on whether total marketing is paying.
When the three disagree, trust the store data and the blended view for budget decisions. Our guide to Google Ads ecommerce conversion tracking shows how to set up the Google side so purchase values reflect what you want to optimize.
Where to spend: channel fit by margin and payback
The right channel mix depends on your payback window and how much proven creative you have. A sound starting point for most established brands is a demand-capture channel plus a demand-creation channel.
- Google Shopping and search capture people who are already looking. They suit products with clear search demand. See our guides on Google Shopping ad metrics and raising Google Shopping conversion.
- Meta creates demand with visual creative and learns as purchase signal accumulates. It fits products whose customer value justifies a payback window of a few weeks.
- TikTok and Pinterest extend reach once you have creative that already works elsewhere. TikTok in particular needs to be read with view-through effects in mind, not last click alone.
One research guide, AdLibrary’s 2026 e-commerce advertising system, suggests that stores spending under €50,000 a month can cover most accessible paid volume with Meta plus Google Shopping, and that a third channel should wait until creative systems are proven on the first two. We treat that as a sensible sequencing rule rather than a law: add channels when the first two are at their profitable ceiling, not when the dashboard is bored.
Our pages on paid search and paid social management describe how Rozee Digital runs these channels.
Creative and landing pages: the levers behind the ROAS
Once your target is set, profit moves through three things: how often you refresh creative, how well the landing page matches the ad, and how fast the page loads.
One Growthegy ROAS guide cites Meta research that the average DTC creative saturates within 14 to 21 days, and recommends launching two or three new creatives every two weeks. The same guide cites Unbounce’s 2024 benchmark report, which found strong message-match pages convert at 2.5 times the rate of mismatched ones, and Google research that a one-second mobile load delay cuts conversions by 20%. Treat those as directional benchmarks and test against your own data.
The practical takeaways:
- Build creative in batches around a few clear hooks, then retire what fatigues.
- Make the landing page headline repeat the promise the ad made.
- Keep product pages fast on mobile, since paid traffic is mostly mobile.
If your landing pages need a rebuild, conversion-focused web design principles are a good place to start the brief. Rozee Digital also builds conversion-focused landing pages alongside static and video ad creative, so the message and the page are designed together.
A weekly profit review for your ad account
The math only helps if it becomes a habit. A review that takes under an hour can look like this:
- Blended view. Check MER and total contribution for the week against the prior four weeks.
- New-customer CAC. Compare True CAC with first-order break-even CAC and with the 90-day ceiling from your cohorts.
- Margin bands. For each band, mark whether it sits above or below its floor and apply one action.
- Creative. Note which ads show falling click-through or rising cost per purchase and queue replacements.
- Retention. Check the repeat rate of the latest 90-day cohort so the acquisition ceiling stays current.
Use Eightx’s scaling test as a quick sanity check on new-customer economics. In its DTC unit-economics article, contribution margin before CAC divided by new-customer CAC above 1.0 means first-order contribution-positive, 0.7 to 1.0 means recoverable through repeat purchases, and below 0.7 is the signal to stop scaling.
Our perspective
Most of the accounts we see in this category are optimized toward the wrong number. The platform reports a ROAS, the team celebrates or panics, and nobody has tied it to margin or to what customers do after the first order.
We built the Ecommerce Acceleration System™ around the idea that acquisition, conversion and retention are one profit equation. Paid media brings the customer in, the landing page and offer decide how many convert, and email and SMS decide how much of that customer’s value you keep. Treat them separately and each team optimizes its own metric while profit leaks between them.
That is also why we keep a deliberately small roster and put senior strategists on the work. Setting a margin-based floor by product, reading cohorts and deciding where the next dollar goes takes judgment, not just campaign management.
Tom
How Rozee Digital can help
If your CAC is rising and your ROAS no longer tells you whether you are growing profitably, Rozee Digital works with established Shopify, WooCommerce and Magento brands on paid media, creative, landing pages, and email and SMS, within one framework aimed at acquisition, conversion and retention. Client work is led by senior strategists, and the roster is kept small by design.

To talk through your numbers and where the next dollar should go, start at Rozee Digital. If paid media is the priority, our Google Shopping ads agency page shows how we approach product-feed-led campaigns, and our customer generation services page covers new-customer growth.
FAQ
What is a good ROAS for ecommerce?
There is no universal good ROAS. Amazon Ads states that a good ROAS is one that is profitable for your business. Your break-even ROAS is 1 divided by your margin after variable costs, and your target should sit above it with room for overhead and profit.
What are typical ecommerce profit margins?
One analysis of 11 public non-food DTC brands found a median gross margin of 56.6%, and a median 2024 net margin of 3% for seven-figure brands, according to Eightx. Your own number depends on product cost, shipping, returns and discounts, so calculate it from your order data before setting targets.
How is MER different from ROAS?
ROAS is attributed revenue divided by spend for one campaign or platform, and each platform counts credit its own way. MER is total store revenue divided by total marketing spend, so it does not depend on attribution. Use ROAS to optimize inside a channel and MER to judge whether marketing as a whole is paying.
How does retention change what I can spend on ads?
Repeat purchases raise what a customer is worth, so you can afford a higher CAC and a lower ROAS. In Magicianly’s example, break-even ROAS falls from 1.82 on the first order to 1.18 once 90-day contribution is counted. Measure it on your own cohorts.
Should I add more channels when ROAS drops?
Often the fix is inside the existing channels: creative freshness, landing page match, product-level floors and measurement. Add a new channel once the first two are at their profitable ceiling and you have creative that already works.
Sources
- Amazon Ads: ads math guide
- Google Ads Help: About return on investment (ROI)
- Seller Profit Guard: break-even ROAS and return loss
- Shopify: break-even ROAS calculator
- MerchantFlow: unit economics documentation
- Eightx: DTC unit economics
- Magicianly: break-even ROAS and retention
- AdAdvisor: optimize Meta ads to LTV
- Product Metrics: ecommerce PPC profitability
- Easy Insights: cross-platform conversion mismatch
- AdLibrary: e-commerce advertisement system
- Growthegy: improve ROAS levers