Ecommerce unit economics tell you whether you make or lose money each time you acquire and serve a customer. You calculate them by taking revenue per order, subtracting every variable cost to reach contribution margin, then subtracting customer acquisition cost (CAC) and adding the margin from repeat orders. If the result is positive, growth adds profit. If it is negative, spending more on ads only makes the loss bigger.
This guide is for founders and marketing leaders at established ecommerce and DTC brands already spending on paid media. It defines each metric, shows the three contribution margin layers, walks through a hypothetical example with the math, and covers what to change when acquisition costs keep climbing.
TL;DR
- Unit economics measure the profitability of acquiring and serving one customer. Positive economics mean each added customer contributes money; negative ones compound losses as you scale.
- Work in layers: CM1 (revenue minus COGS), CM2 (minus fulfillment, shipping and processing) and CM3 (minus CAC). Gross margin alone hides the real picture.
- Your break-even ROAS is 1 divided by your contribution margin rate. A campaign can look strong in the ad platform and still lose cash.
- Retention is the lever that spreads CAC over several orders, so model new-customer economics and repeat revenue separately.
Table of Contents
- What ecommerce unit economics actually measure
- The metrics you need, defined
- The three contribution margin layers
- A worked example, step by step
- How to read CAC, LTV and payback together
- Break-even ROAS and MER: connecting the model to your ad accounts
- Signs your unit economics are breaking
- How to improve unit economics when CAC is rising
- Perspective: why we model all three stages together
- Get your unit economics reviewed by senior strategists
- FAQ
- Sources
What ecommerce unit economics actually measure
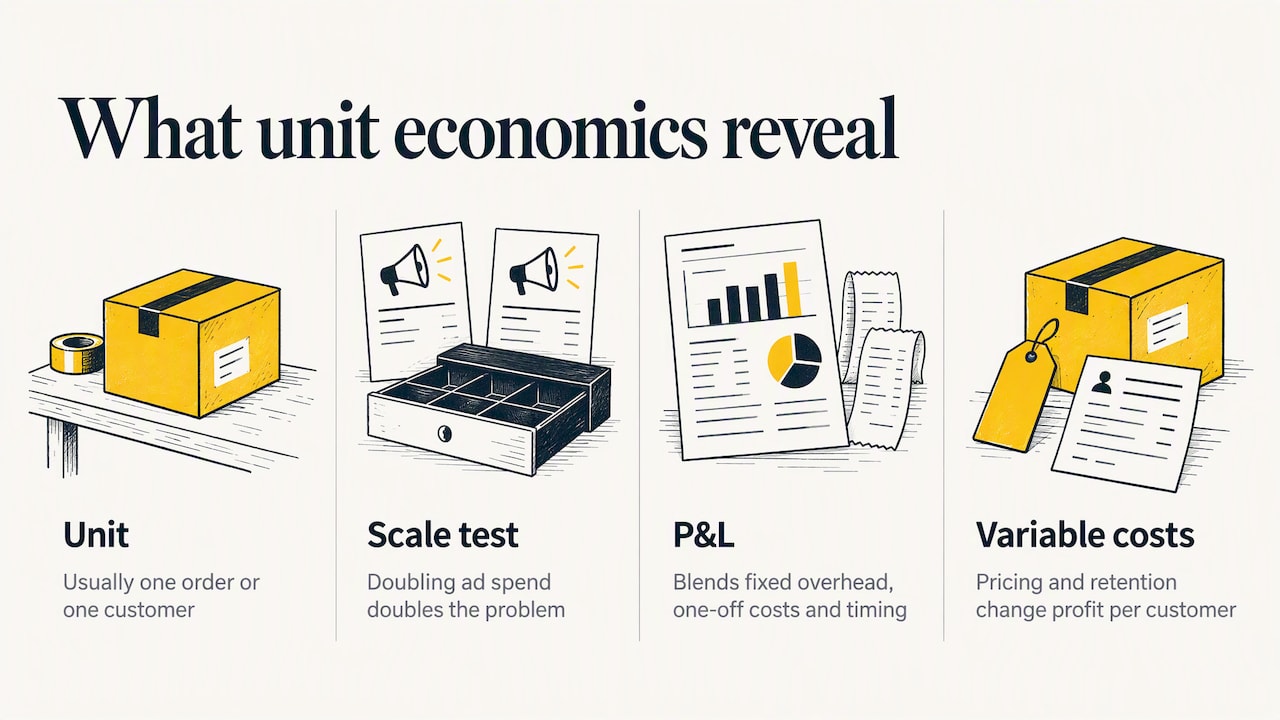
A “unit” is whatever you can count and attribute costs to. In ecommerce that is usually one order or one customer. Paddle’s guide describes unit economics as the direct revenues and costs of a quantifiable unit, measured per unit, which helps forecast break-even points and margins.
The point is a scale test. A brand with healthy revenue growth can still be unprofitable on every sale. When that is the case, doubling ad spend doubles the problem. The University of Virginia’s Foundry glossary frames it the same way: good unit economics mean making money on each customer, bad ones mean losing money at scale.
This is also why unit economics differ from a P&L. A P&L blends fixed overhead, one-off costs and timing effects. Unit economics isolate variable costs, so you can see which decisions (pricing, shipping thresholds, channel mix, retention) change profit per customer. Toptal’s finance guide notes that unit economics are built on a variable-cost basis and are a basic part of break-even analysis.
The metrics you need, defined
Before the math, here are the terms used throughout.
- AOV (average order value): revenue divided by number of orders.
- COGS (cost of goods sold): what the product costs you landed, including freight and duties where they apply.
- Contribution margin: net revenue minus variable costs. Fixed costs such as rent, salaries and software sit outside it.
- CAC (customer acquisition cost): acquisition spend divided by new customers acquired. Our guide to the customer acquisition cost formula covers variations in detail.
- LTV (lifetime value): the net profit you expect from a customer relationship. Shopify’s analysis guide calculates it from average purchase value, purchase frequency and customer lifespan. For unit economics, use margin-based LTV, not revenue.
- ROAS (return on ad spend): revenue attributed to ads divided by ad spend. It is a platform-reported number and ignores your costs.
- MER (marketing efficiency ratio): total store revenue divided by total ad spend. It is blended, so it is harder to game with attribution quirks.
- Payback period: how long it takes a cohort’s contribution margin to repay what you spent to acquire it.
The three contribution margin layers
The cleanest way to build the model is in layers. NStar Finance’s ecommerce guide lays out three: CM1 is revenue minus COGS, CM2 subtracts fulfillment and shipping, and CM3 subtracts CAC.
Each layer answers a different question:
| Layer | What it subtracts | The question it answers |
|---|---|---|
| CM1 | COGS | Is the product priced well enough? |
| CM2 | Fulfillment, shipping, packaging, payment processing, returns | Does the order itself make money? |
| CM3 | CAC | Does acquiring this customer make money on the first order? |
The same source warns that leaving out fulfillment, shipping or processing can make gross margin look healthy while hiding the margin you actually keep. Another methodology page lists the usual variable items: product cost, shipping, packaging, fulfillment, payment and marketplace fees, attributed advertising and a returns provision. It treats rent, salaries, software, taxes, depreciation and financing as fixed and keeps them out.
Returns deserve special attention. One industry write-up puts apparel return rates at 15 to 30 percent versus 2 to 5 percent for food and supplements. Whatever your category, use your own return rate and the real cost of processing a return, not a generic allowance.
A worked example, step by step
The numbers below are hypothetical. They are not Rozee Digital client data. They show the mechanics so you can swap in your own figures.
A DTC brand sells a product at an AOV of $90.
Step 1: CM1. COGS is $36 per order. CM1 = $90 − $36 = $54 (60%).
Step 2: CM2. Subtract $12 for pick, pack and outbound shipping, $3 for payment processing and a $4 returns allowance. CM2 = $54 − $12 − $3 − $4 = $35 (about 38.9% of AOV).
Step 3: CM3. Blended new-customer CAC is $48. CM3 = $35 − $48 = −$13 per new customer on the first order.
The first order loses $13. That is not automatically a problem, because many healthy brands acquire at a loss and recover on repeat purchases. It becomes a problem only if the repeat orders never arrive, or arrive too slowly.
Step 4: Add repeat behavior. Suppose, hypothetically, that customers in this cohort place an average of 1.5 additional orders in 12 months. Each repeat order earns the same $35 CM2, minus $5 of email and SMS cost per order, so $30 each. That is 1.5 × $30 = $45.
Step 5: Twelve-month result. −$13 + $45 = $32 contribution per acquired customer, before fixed costs.
Now check the same brand’s ad platform. First-order ROAS is $90 ÷ $48 = 1.88. That looks mediocre. The first-order break-even ROAS is 1 ÷ 0.389 = 2.57, so the first order is below break-even, which matches the −$13. The platform number and the P&L agree here, but only a unit economics model tells you the cohort is still profitable by month twelve, and how sensitive that is to repeat rate.
Stress-test the assumptions
Change one input at a time:
- If CAC rises 20% to $57.60, the first order loses $22.60. The cohort still earns about $22.40 after 12 months, but payback is slower.
- If repeat orders fall from 1.5 to 0.5, the 12-month result is −$13 + $15 = $2. The business is barely breaking even per customer.
- If the return rate doubles and the returns allowance goes from $4 to $8, CM2 falls to $31 and every layer below it shrinks.
The repeat rate moved the outcome more than the CAC change did. That is typical, and it is why retention belongs in the same model as acquisition.
How to read CAC, LTV and payback together
CAC tells you what you pay. LTV tells you what you get back over time. Their relationship decides whether the model is sustainable, and retention is what improves it, because retention amortizes CAC over multiple orders, raising LTV and shortening payback.
Two rules of thumb are commonly cited. The same guide gives an LTV:CAC ratio of 3:1 to 5:1 as generally healthy, with CAC payback under 6 months for venture-backed brands and under 12 for bootstrapped ones. Treat them as starting points. A brand with high gross margin, strong repeat rates and cash to spare can run a lower ratio. A brand with thin margins or tight cash needs a higher one.
A useful reference for how thin a ratio can get: one subscription platform’s worked example uses a $100 AOV, $55 gross profit per order, 2.8 lifetime orders and a $75 CAC, which gives $79 in lifetime profit and an LTV:CAC ratio of 2.1. Profitable, yet well short of 3:1.
Keep new-customer and repeat revenue apart
The most common modeling error is mixing the two. Bloom Analytics recommends separating new-customer economics from repeat revenue, because folding repeat revenue into the acquisition calculation makes the first-order model look healthier than it is. Calculate net revenue from new customers per new customer, subtract variable order costs, then subtract CAC.
Blended CAC versus paid CAC
Blended CAC divides total marketing spend by all new customers, including those who came from organic, referral and direct. Paid CAC divides paid media spend by customers from paid channels only. Blended CAC often understates the true cost of paid acquisition. If paid is where you plan to scale, model paid CAC at the margin. For more on definitions and ranges, see our breakdown of customer acquisition cost metrics and CAC by industry.
Break-even ROAS and MER: connecting the model to your ad accounts
Your media buyers work in ROAS. Your finance model works in contribution margin. The bridge is simple: break-even ROAS = 1 ÷ contribution margin rate. One Shopify community contributor makes the point that a campaign can look successful in Meta while losing cash when the target ignores margin. Treat that as a practitioner’s illustration, not a rule, but the arithmetic is sound.
A few practical notes:
- Use CM2 rate (before ad spend) as the denominator. In the example, 38.9% gives 2.57.
- Set separate targets for new and returning customers. Returning customers cost less to reach, so a blended ROAS target hides weak prospecting.
- Track MER alongside platform ROAS. It uses total store revenue over total ad spend, so it does not depend on any one platform’s attribution window.
- Check platform guidance for how each ad platform defines conversion and attribution before comparing numbers across channels.
To see where your margins sit compared with peers, our guide to ecommerce profit margins is a good companion.
Signs your unit economics are breaking
Watch for these patterns:
- Blended CAC exceeds CM2 per order and cohorts do not repay it in a reasonable window. NStar’s guide lists this as a breakdown signal, along with payback periods longer than your cash cycle and cohort LTV curves that flatten before reaching 3:1.
- Revenue grows but cash tightens. Payback is longer than the time between paying for inventory and ads and receiving cash.
- Discounting lifts conversion but erodes CM1 more than it lifts volume.
- Newer cohorts repeat less than older ones. Blended LTV hides this, so review cohorts by acquisition month.
Acquisition costs are a common pressure. One industry source reports ecommerce CAC up 6 to 12 percent year over year, and we cover the context in our piece on what to do differently as CAC keeps rising.
How to improve unit economics when CAC is rising
There are only so many levers: raise margin per order, lower the cost to acquire, or earn more orders per customer. Work through them in this order, because the cheapest fixes are usually on the margin side.
1. Fix CM2 before touching ads
Review shipping cost against shipping revenue, packaging, and payment processing. Set free-shipping thresholds just above your current AOV to nudge basket size. Audit the products with the highest return rates and fix sizing, imagery or descriptions. Every dollar added to CM2 raises the amount you can afford to pay for a customer.
2. Raise conversion rate
If you convert more of the traffic you already pay for, CAC falls without changing bids. Landing page relevance, offer clarity, page speed and checkout friction are the usual places to look. Pair this with creative testing so that the ad promise and the page match.
3. Improve paid media efficiency
Separate prospecting from retargeting, judge each against its own break-even, and cut spend where incremental return is weak. Search captures existing demand and social creates it, so the two should have different targets. Our pages on paid search and paid social management describe how we approach each.
4. Segment and personalize
Not all customers are worth the same. Shopify suggests RFM analysis, which scores recency, frequency and monetary value, to find high-value segments. Use it to shape offers, suppress discounts for people who would buy anyway, and build lookalike audiences from your best buyers. See our guide to ecommerce segmentation for practical groupings.
5. Invest in retention
Retained customers tend to spend more and cost less to serve, and acquiring new customers is generally more expensive than keeping existing ones. Shopify cites that a 5% increase in retention can lift profits by 25% or more. Treat that figure as directional: the effect depends on your margins and repeat patterns, which is exactly what your cohort model measures.
In practice that means post-purchase flows, replenishment reminders, win-back sequences and well-timed SMS. For a broader look at the tactics, this overview of how to increase customer retention covers several approaches, and for subscription models our email retention playbook goes deeper. Brands moving beyond the first sale may also want our view on building a D2C brand past the first order.
Perspective: why we model all three stages together
Most of the brands we speak with already know their ROAS. Far fewer can say what a new customer is worth after returns, shipping and retention costs, or how that changes by channel. When acquisition, conversion and retention are run as separate projects, each team optimizes its own number, and the sum can still lose money.
That is why Rozee Digital built the Ecommerce Acceleration System™ around all three stages. We would rather start an engagement with a contribution margin model than with a media plan. Our work is led by senior strategists, and we keep our client roster small on purpose, so the person who builds the model is the person who reads the cohorts a quarter later.
Our view is simple: a brand should be able to scale spend with confidence because it knows its break-even, not because a dashboard looks good. If you cannot state your CM2 rate and your payback window from memory, fix that before you add budget.
— Tom
Get your unit economics reviewed by senior strategists
If you run an established Shopify, WooCommerce or Magento brand and want paid media, conversion and retention managed against profit rather than platform ROAS, Rozee Digital can help. We work across Google, Meta, Pinterest and TikTok ads, creative, landing pages, and Klaviyo email and SMS, all tied to the same margin targets.
See our services and get in touch to talk through where your model leaks. If email and SMS are your biggest gap, start with our Klaviyo setup and optimization page.
FAQ
How do you calculate unit economics of a product?
Start with the selling price and subtract COGS to get CM1. Subtract fulfillment, shipping, packaging, payment fees and a returns allowance to get CM2. Subtract CAC to get CM3. Run the same calculation per product and per customer, then compare.
What is a good LTV to CAC ratio for ecommerce?
A ratio of 3:1 to 5:1 is commonly cited as healthy, with payback under 6 to 12 months depending on funding. Your own threshold depends on margins and cash. Lower ratios can work if payback is fast and repeat rates are reliable.
Should CAC include only paid ads?
Use both views. Blended CAC shows overall efficiency. Paid CAC shows what the next ad dollar really buys, so it should drive scaling decisions. Include agency fees, creative production and tooling in acquisition spend if you want a full-cost view.
What is the difference between ROAS and MER?
ROAS is revenue attributed to ads by a platform divided by spend on that platform. MER is total store revenue divided by total ad spend across all channels. MER is less sensitive to attribution disputes, while ROAS is useful for judging individual campaigns against a margin-based break-even.
Sources
- Unit Economics, Startup glossary, The Foundry at UVA
- Unit economics 101, Paddle
- Why Unit Economics Still Matter, Toptal
- E-Commerce Unit Economics: CAC, LTV, and Contribution Margin, NStar Finance
- Calculation methodology, Profyza
- E-commerce Unit Economics, Baratelli Institute
- Customer Lifetime Value Analysis, Shopify
- Maximize Growth and Subscriber LTV with Unit Economics, Ordergroove
- Ecommerce Unit Economics: Easy and Practical Analysis, Bloom Analytics
- How to measure success of marketing campaign?, Shopify Community
- VIP Customer Strategy, Shopify
- Customer Retention, Stripe
- Ecommerce Growth Guide, Shopify
- How to increase customer retention: 5 proven strategies