Repeat purchase rate is the share of your customers who have bought from you more than once. You get it by dividing the customers with two or more orders by all customers who ordered in the same period, then multiplying by 100. A 20% rate means one buyer in five came back. Below we cover the formula, the mistakes that make it misleading, realistic benchmarks by category, and the levers that move it.
TL;DR
- Repeat purchase rate = customers with 2+ orders ÷ all unique customers in the same window × 100. Count people, not orders.
- Track it by acquisition cohort in a fixed window, or recent buyers will drag your blended number down.
- There is no universal “good” rate. Consumables sit far above fashion and durables, so benchmark against your own category and buying cycle.
- It is not the same as retention rate: one counts purchases, the other counts customers who are still active.
- Raising it lowers your blended acquisition cost, because every returning buyer is revenue you did not have to buy again.
Table of Contents
- What repeat purchase rate measures
- The formula
- Choosing a measurement window
- Repeat purchase rate vs. retention rate
- What is a good repeat purchase rate?
- Why it changes the economics of paid media
- How to increase repeat purchase rate
- Our perspective
- Working on this with us
- FAQ
- Sources
What repeat purchase rate measures
Repeat purchase rate (RPR) is the percentage of customers who make more than one purchase from your store. It is a loyalty signal, but a hard-edged one: it does not ask whether customers like you, only whether they paid you again. Yotpo describes it as a measure of loyalty and retention, and notes that repeat customers can support steadier revenue and more consistent growth.
Readers also search for this as “repeat customer rate”. It is the same idea. The denominator is the only place definitions differ, and that is where most reporting errors start, so we treat it carefully below.
For a brand already spending on paid media, the metric matters for a practical reason. Every first order has a cost attached. If few buyers return, each order has to pay back its acquisition cost on the first sale. If many return, the same ad spend produces more revenue over time and your ceiling on what you can afford to pay for a customer goes up.
The formula
The standard version: repeat-purchase customers divided by total purchasing customers, times 100. The denominator is the total number of unique customers who purchased during the measurement period.
A more precise phrasing from a calculator guide: customers with two or more orders during the window, divided by total unique customers who placed at least one order in that same window, times 100.
Worked example
Say your store had 4,000 unique customers place orders over the last 12 months. Of those, 760 placed two or more orders.
- 760 ÷ 4,000 = 0.19
- 0.19 × 100 = 19%
Your repeat purchase rate is 19%. The published reference example uses larger numbers but the same logic: 20,000 repeat customers out of 100,000 gives 20%.
Notice what the example does not do. It does not count the 760 customers’ total orders. A customer who ordered six times counts once in the numerator, exactly like a customer who ordered twice. If you want to see order depth, look at orders per customer as a separate number.
Three mistakes that distort the number
Metabase’s metric guide flags the usual calculation errors: counting orders instead of customers, mixing time windows, and failing to deduplicate guest checkouts by email. In practice:
- Counting orders, not customers. If 5,000 orders came from 4,000 customers, the rate is not 25%. It is based on how many of those 4,000 ordered more than once.
- Mixing windows. Numerator from all time and denominator from one year will inflate the result. Use the same window for both.
- Guest checkouts. The same person checking out as a guest three times looks like three customers. Match on email (and phone where you collect it) before you count.
The third point has a bigger consequence than it seems. A Bluecore report built on 2023 data found that retailers identifying more than 40% of their traffic saw repeat purchase rates 53% above average, while those below 10% sat 33% below average. Bluecore treats the ability to link sessions and purchases to one known person as the foundation for lifecycle marketing. If you cannot recognize a returning buyer, you cannot measure them, and you cannot message them well either.
Choosing a measurement window
Pick one window and keep it. Twelve months suits most brands, but the right answer depends on how often your product is naturally rebought. A coffee brand might look at 90 or 180 days. A furniture brand needs two or three years before the number means anything.
Then split by cohort. Metabase recommends tracking RPR in a fixed window and by acquisition cohort, such as first-order month, so recent buyers who have not had time to return do not distort a blended average.
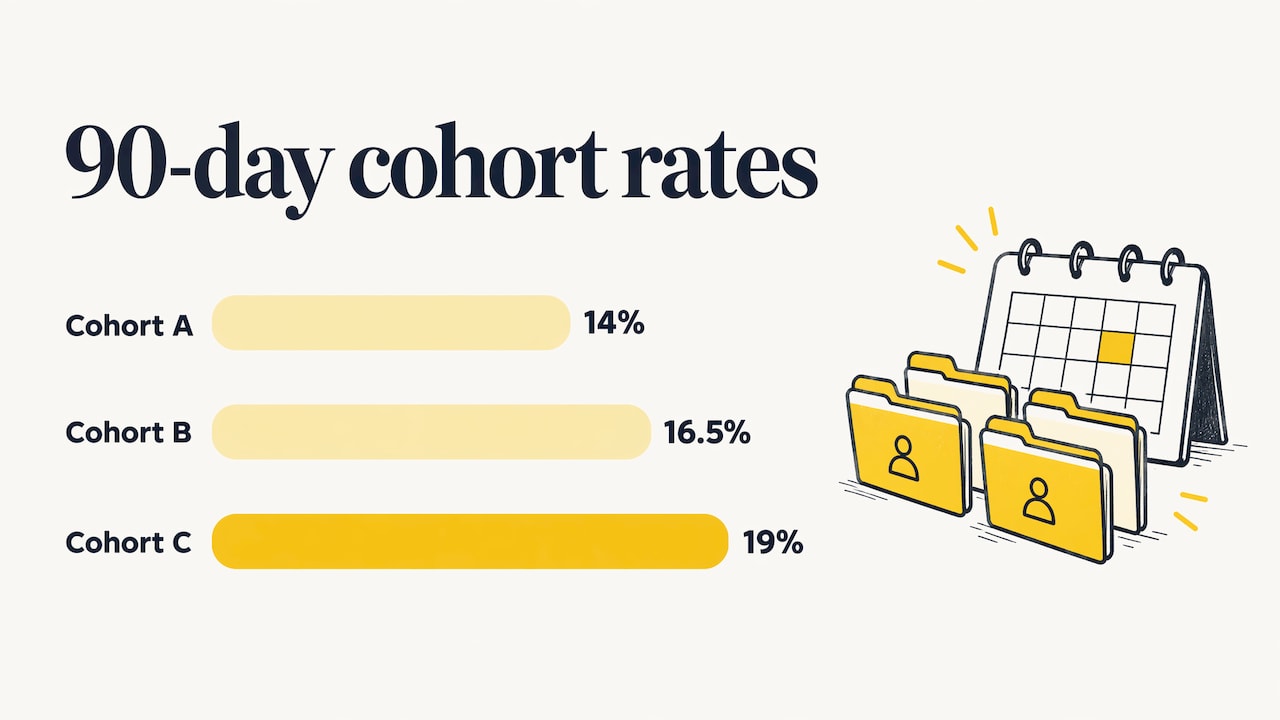
Here is why that matters. Imagine you ran a heavy acquisition push last month. Those customers have had 30 days to reorder. In a blended, all-customer calculation they pull your rate down, and you might conclude retention got worse when it did not. A cohort table fixes this by comparing like with like.
A simple cohort view looks like this:
| First-order month | Customers | Reordered within 90 days | 90-day repeat rate |
|---|---|---|---|
| Cohort A | 1,000 | 140 | 14% |
| Cohort B | 1,000 | 165 | 16.5% |
| Cohort C | 1,000 | 190 | 19% |
(Illustrative numbers to show the layout, not benchmarks.) If each cohort beats the last at the same age, something you changed is working. That is a far better test of your retention program than a single blended percentage.
Repeat purchase rate vs. retention rate
These two get confused constantly, and for good reason: both describe customers coming back. The difference is what counts as “back”.
- Repeat purchase rate looks at who bought again. It reveals purchasing and revenue recurrence directly.
- Retention rate looks at whether customers remain active and engaged, which can include opening emails, visiting the site or using an account, even without a new order.
One Brazilian commerce publication makes the point that the two are complementary: repeat purchase rate alone can mislead if you do not also check whether quiet customers are still engaging with the brand.
There is a second caution in the other direction. Route argues that repeat customer rate is a useful indicator of customer experience and future revenue durability, but that a 100% rate could mean acquisition has stopped. Read the metric next to new-customer growth, not in place of it.
A quick rule for which to use: if the question is “are people buying again?”, use RPR. If the question is “are people still with us?”, use retention. Subscription brands will lean on retention and churn. One-off purchase brands will lean on RPR.
What is a good repeat purchase rate?
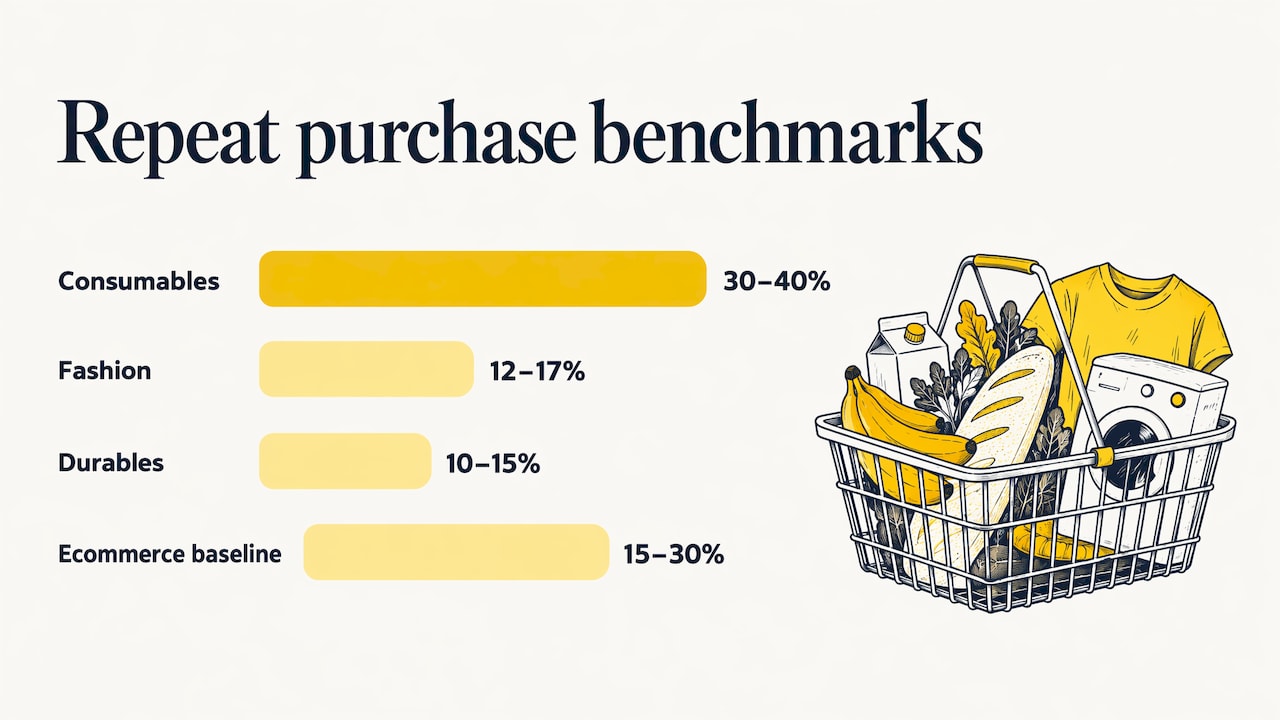
It depends on what you sell. One dataset compiled by Realsiteworth puts consumables at 30 to 40% or more, fashion at 12 to 17%, and durable goods at 10 to 15%. Its wider ranges are 22 to 44% for consumables, 10 to 17% for apparel and 7 to 18% for durables and general retail.
For a broad ecommerce baseline, Tremendous cites roughly 15 to 30%, and says targets run higher for consumables and subscriptions and lower for expensive, infrequent purchases such as laptops, luxury goods and appliances.
| Category | Typical repeat purchase rate |
|---|---|
| Consumables (food, supplements, beauty refills) | 30 to 40% |
| Fashion and apparel | 12 to 17% |
| Durables and general retail | 10 to 15% |
| Broad ecommerce baseline | 15 to 30% |
Treat these as orientation, not targets. They come from compiled datasets with different methods and windows, and your own history is the better benchmark. Three questions give you a more useful read than any industry average:
- How long is your natural repurchase cycle? A 60-day shampoo and a 5-year mattress cannot share a goal.
- What is your rate by first product bought? Often one entry product produces most of your repeat buyers.
- What is your rate by acquisition channel? Customers from some campaigns return far more than others, and that should change how you bid.
Why it changes the economics of paid media
When acquisition costs climb, brands usually look for cheaper clicks. The other lever is making each acquired customer worth more. Investopedia cites the commonly repeated figures that acquiring a new customer costs five times as much as keeping a current one, and that return customers tend to spend about 300% more than one-time buyers over time. Those are broad rules of thumb rather than your numbers, so check them against your own order data. The direction, though, is reliable: returning buyers cost less to sell to.
Repeat purchase rate also connects to lifetime value (LTV). Route notes that repeat customer rate tracks second and later purchases, while lifetime value measures total customer spending net of acquisition and retention costs. RPR is an early, quick-moving input. LTV is the slower outcome.
If you want to see how this feeds your ad budget, start with your customer acquisition cost formula, then read our breakdown of what makes acquisition cost too high. A brand with a 15% repeat rate and a brand with a 30% repeat rate can tolerate very different first-order CAC for the same margin.
How to increase repeat purchase rate
There is no single trick. The levers fall into a sequence that follows the customer after the first order.
1. Fix identification first
You cannot retarget or email someone you cannot recognize. Capture email at or before checkout, encourage account creation without forcing it, and merge guest orders by email. This is unglamorous and it is where the Bluecore finding above starts.
2. Make the post-purchase window count
The days after a first order are when a brand is most top of mind. Send a useful sequence: shipping and delivery updates, how to use the product, a review request, then a replenishment or complementary-product message timed to the real usage cycle. Our guide to email marketing for repeat purchases walks through the flows, and the wider email strategy guide covers campaign cadence.
3. Segment by what people bought
A buyer of a starter kit and a buyer of a refill pack need different messages. Group customers by product, order value, time since last order and channel, then write to those groups. See our notes on e-commerce segmentation and personalization.
4. Use loyalty and referral where the economics fit
Investopedia lists the familiar tools: loyalty programs, testimonials and referrals from repeat customers, brand-ambassador engagement, discounts on previously purchased items, and information on new products or new uses. Smile.io research found that small to medium brands processing 500 to 5,000 orders a month saw the biggest year-over-year growth in loyalty-generated value in 2024, at 23.93%. Loyalty is not only for large retailers. Be careful with discounts, though: if every second order needs a coupon, you are training margin away.
5. Bring lapsed buyers back with paid media
Paid social and search are not only acquisition tools. Customer lists let you exclude recent buyers from prospecting, and target people who are approaching their usual reorder date. We cover the mechanics in our piece on remarketing tactics.
6. Give subscription customers a way to pause
For subscription models, Shopify’s retention guide reports Recurly’s 2026 analysis that a “pause before cancel” option works: three out of four subscribers who pause eventually return. Our subscription email playbook covers the churn side in more detail.
If you want a wider view of the tactics beyond purchase frequency, this overview of ways to increase customer retention covers the related customer metrics.
Our perspective
Most agencies we meet treat repeat purchase rate as the email team’s problem and ad performance as the media team’s problem. We think that split is where profit leaks.
Here is how we see it. Paid media decides who walks in the door. Conversion work decides how many of them buy. Retention decides whether that first sale was the start of a relationship or the end of one. If the three are managed separately, the media buyer optimizes for cheap first orders, and cheap first orders are often the lowest-value customers. That is how a brand ends up with healthy-looking ROAS and a shrinking margin.
That is the idea behind our Ecommerce Acceleration System™: acquisition, conversion and retention planned as one profit-focused system. In practice, it means we want to know your repeat rate by channel and by first product before we touch bids. It also means we would rather accept a slightly higher first-order cost from a campaign that brings back buyers who reorder than chase a cheap CPA that never returns.
Two habits we would push on any established brand:
- Report repeat rate by cohort every month, next to CAC, so retention and acquisition are judged together.
- Do not celebrate a rising blended rate without checking new-customer volume. A rate that improves because you stopped acquiring is not growth.
This work is led by senior strategists, and we keep our client roster deliberately small so that this level of attention is possible.
— Tom
Working on this with us
If you run an established Shopify, WooCommerce or Magento brand and your repeat rate is flat while acquisition costs rise, this is the problem we are set up to work on. We combine paid media, creative, conversion-focused landing pages and Email & SMS built around lifetime value and profit, so the same team sees the whole customer journey.
If the gap is in lifecycle messaging, our Klaviyo setup and optimization work is the natural starting point. If you want to see the full list of what we run, start on the Rozee Digital homepage.
FAQ
What does repeat purchase rate mean?
It is the percentage of your customers who have purchased more than once in a given period. If 200 of 1,000 customers ordered at least twice, your rate is 20%. It shows how well you turn first-time buyers into returning ones.
How do you calculate repeat purchase rate?
Divide the number of customers with two or more orders in your chosen window by the total number of unique customers who ordered in that same window, then multiply by 100. Count customers, not orders, and match guest checkouts by email so one person is not counted several times.
What is the difference between retention rate and repeat purchase rate?
Repeat purchase rate counts customers who bought again. Retention rate counts customers who remain active with your brand, which may include engagement without a new order. Use both: the first tells you about revenue recurrence, the second about relationship health.
Is a higher repeat purchase rate always better?
Not on its own. A very high rate can mean you have stopped acquiring new customers, so read it next to new-customer growth. It also should not be bought with constant discounting that erodes margin.
How long should my measurement window be?
Match it to your natural repurchase cycle: shorter for consumables, longer for durable goods. Whatever you choose, keep it fixed and track by first-order cohort so comparisons stay fair.
Sources
- What Is Ecommerce Repeat Purchase Rate? (Yotpo)
- Repeat Purchase Rate: Formula and Calculator (Wall Street Prep)
- How to Calculate Repeat Purchase Rate (Reotter)
- Repeat Purchase Rate: Definition, SQL and Tracking (Metabase)
- Bluecore identification rate report (GlobeNewswire)
- Taxa de recompra (Wake)
- Repeat Customer Rate: Is it the Most Important KPI? (Route)
- Repeat purchase rate benchmarks (Realsiteworth)
- Turn first-time buyers into repeat customers (Tremendous)
- Understanding Repeat Sales in E-Commerce (Investopedia)
- The State of Ecommerce Customer Loyalty (Smile.io)
- 14 Customer Retention Strategies for Ecommerce (Shopify)