
The right ecommerce marketing budget is the amount you can spend while every extra dollar still returns more contribution margin than it costs. Percentage-of-revenue benchmarks give you a place to start, usually somewhere between 8% and 15% for established brands. Your gross margin, your customer acquisition cost (CAC) and your customers’ lifetime value (LTV) decide where you land. Rozee Digital builds budgets for established Shopify, WooCommerce and Magento brands around those numbers, across acquisition, conversion and retention together.
TL;DR
- Benchmarks put average marketing spend near 9% of revenue for U.S. companies and around 12% for B2C product companies. Treat that as a starting range, not a target.
- Work backward from margin: your break-even ROAS is 1 divided by your contribution margin before ads. Spend only where marketing efficiency stays above it.
- Once you are established, let LTV:CAC govern spend. A channel whose CAC creeps toward LTV is losing margin on every added dollar.
- Split the budget across acquisition, conversion and retention, and review it monthly or quarterly, with a weekly watch on MER.
- Measure incrementality, not just platform-reported ROAS, before moving big amounts between channels.
Table of Contents
- What the benchmarks say, and how to read them
- Why margin matters more than the percentage
- Use LTV:CAC once you are established
- What belongs in the budget
- How to split the budget across the funnel
- Build the budget in six steps
- Measure what the budget actually produces
- Our perspective
- Where Rozee Digital fits
- FAQ
- Sources
What the benchmarks say, and how to read them
Start with the numbers readers search for. The CMO Survey’s 2026 report, as summarized by Anlyto, found an average marketing budget of 8.96% of revenue among responding U.S. companies, with B2C product companies at roughly 12.0%. The same summary says companies under $10M in revenue averaged about 13%, while those above $1B averaged 6% to 9%.
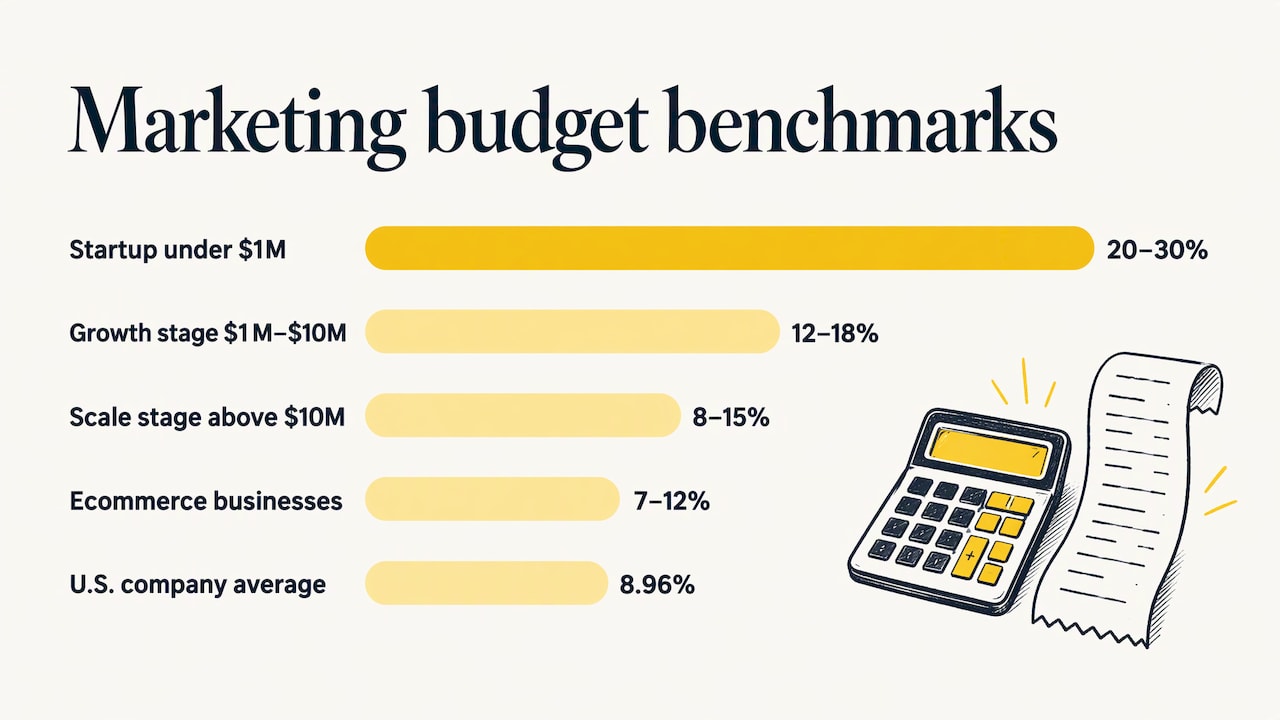
Ecommerce-specific guides land in a similar band. Hostinger’s budget guide says ecommerce businesses generally allocate 7% to 12% of revenue, rising to as much as 20% for newer or growth-focused brands. CFO Expertise gives stage ranges: startups under $1M at 20% to 30%, growth-stage brands at $1M to $10M at 12% to 18%, and scale-stage brands above $10M at 8% to 15%.
These figures come from different samples, different definitions of “marketing” and different years. Some include salaries, some count only media. So the pattern matters more than any one number:
| Brand stage | Typical share of revenue | What drives it |
|---|---|---|
| Early (under $1M) | 20% to 30% | Building demand from zero |
| Growth ($1M to $10M) | 12% to 18% | Scaling paid channels, building email lists |
| Scale ($10M+) | 8% to 15% | Repeat purchases carry more revenue |
The stage ranges above are from CFO Expertise. Younger brands spend more because they have fewer returning customers. Mature brands spend a smaller share because repeat purchase does part of the work.
One more caution on the denominator. Your store platform, GA4 and your ad platforms rarely report the same revenue, as Anlyto’s analysis points out. Pick one trusted revenue figure, usually the store’s net sales after refunds, and use it every time you calculate a percentage.
Why margin matters more than the percentage
Two brands can both spend 12% of revenue and be in very different places. A brand with a 70% gross margin keeps far more of each sale to pay for marketing than a brand at 35%. A flat percentage ignores that.
Here are the terms you need:
- ROAS (return on ad spend): revenue attributed to ads divided by ad spend. A 3.0 ROAS means $3 of revenue per $1 spent.
- MER (marketing efficiency ratio): total revenue divided by total marketing spend, across all channels. It does not depend on which platform claims credit for a sale.
- CAC (customer acquisition cost): marketing spend divided by new customers won.
- LTV (lifetime value): the gross profit, or revenue, a customer generates over their relationship with you. Use one definition consistently.
- Contribution margin: revenue minus product cost, shipping, payment fees and other variable costs, before ad spend.
Find your break-even
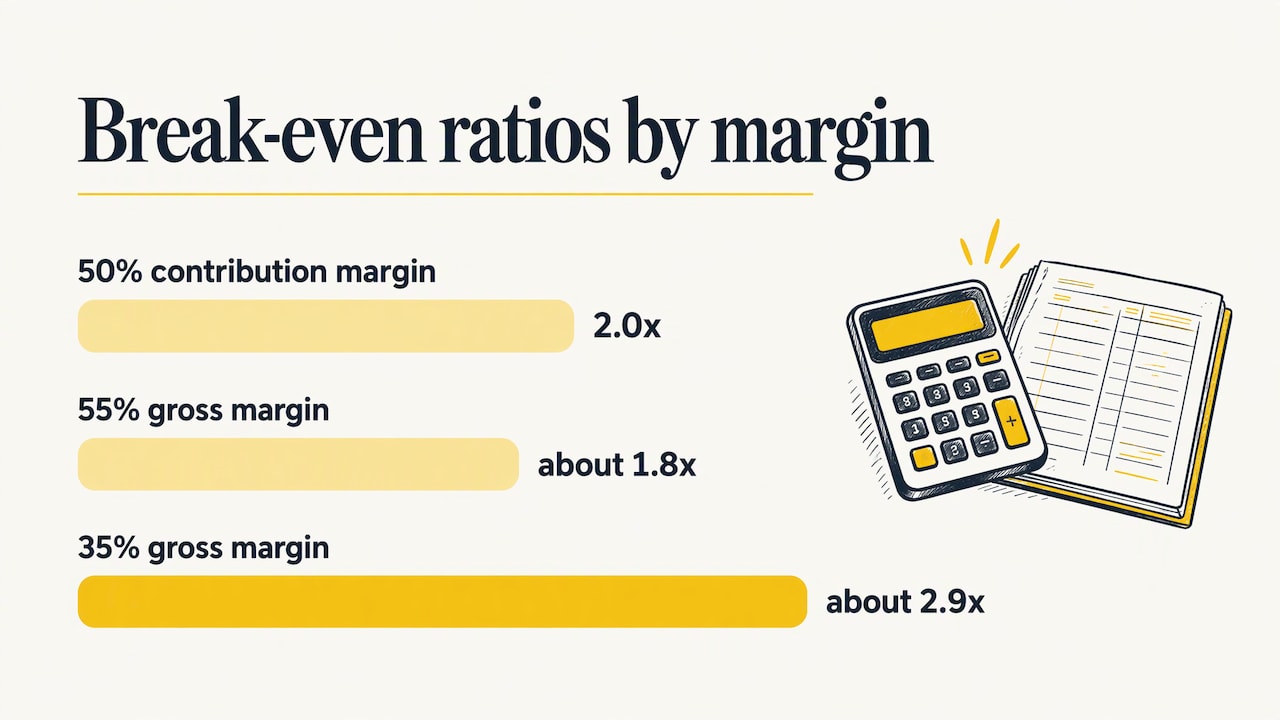
Break-even ROAS is 1 divided by your contribution margin before ads. At 50%, break-even is 2.0. Below it, each ad dollar loses money on the first order. A Triple Whale setup guide gives the same logic for MER: a brand with a 55% gross margin needs at least about 1.8x, and one at 35% needs about 2.9x, to stay contribution-positive.
To see how it plays out, take a hypothetical brand (an illustration, not a client result):
- Annual revenue: $5,000,000
- Contribution margin before ads: 45%
- Target profit after marketing: 20% of revenue
The most it can afford to spend on marketing is 45% minus 20%, or 25% of revenue, which is $1.25M. That is well above the benchmark averages, and it does not mean the brand should spend it. It means the ceiling is set by the margin, and the brand can find out how much of that headroom it can use profitably. If the brand’s MER is 4.0 at 25% spend, break-even MER is 1 ÷ 0.45, or about 2.2, so there is room. If MER falls to 2.4 as spend rises, the marginal dollars are close to break-even and the extra spend should stop.
Our guide to ecommerce unit economics walks through the underlying calculation, and the customer acquisition cost formula covers CAC in detail.
Use LTV:CAC once you are established
The percentage rule gets a new brand started. For an established brand, the governing ratio is LTV against CAC. A common rule of thumb in budgeting guides is an LTV:CAC of at least 3:1. When a channel’s CAC creeps toward LTV, every added dollar shrinks margin, and no ROAS figure changes that arithmetic.
This matters most for brands whose repeat rate is strong. If customers reorder, a first-order CAC above your first-order margin can still pay back. But you need to know the payback period and your cash position. A brand with 60% of buyers reordering within 90 days can fund a more aggressive acquisition budget than one where most customers buy once.
Rising CAC makes this more pressing. Our piece on why customer acquisition cost is rising covers what to do when the same spend buys fewer new customers, and our CAC benchmarks help you place your own number in context.
What belongs in the budget
A budget that counts only ad spend understates what growth costs. Include:
- Paid media: Google, Meta, TikTok, Pinterest and similar channels. Guides commonly put paid advertising at roughly half to two-thirds of the marketing budget, according to one 2026 benchmark roundup, with content and SEO, email and influencer or affiliate programs sharing the rest.
- Creative: static and video ads. Creative is the main lever on conversion in paid social, and it wears out, so budget for a steady supply rather than a one-off batch.
- Conversion work: landing pages, product page tests, checkout improvements. This raises the return on every dollar of traffic you buy.
- Retention: email and SMS platforms, flows, campaigns, loyalty. This is where LTV is built.
- Content and SEO: slower to pay back but it lowers blended CAC over time. Content marketing for ecommerce works best when planned with the same revenue targets as paid.
- Tools and measurement: attribution, analytics, A/B testing, subscription platforms.
- Agency or team costs: fees or salaries for people who run all of the above.
Decide up front whether your percentage includes people and tools. Most benchmarks are unclear on this, which is one reason to treat them loosely.
How to split the budget across the funnel
Spend divides into awareness (reaching new people), consideration, conversion (closing warm shoppers) and retention. A full-funnel framework from Modern Marketing Institute suggests starting allocations by brand age:
| Brand age | Awareness | Consideration | Conversion | Retention |
|---|---|---|---|---|
| 0 to 12 months | 40% to 50% | 20% to 25% | 20% to 25% | 5% to 10% |
| 1 to 3 years | 25% to 35% | 20% to 30% | 30% to 40% | 10% to 15% |
| 3+ years | 15% to 25% | 20% to 25% | 35% to 45% | 15% to 20% |
The same source describes these as starting points to review monthly. It suggests shifting toward the top of the funnel when retargeting frequency rises above five or six impressions per week while conversions fall, because the warm audience is wearing out.
Two practical points follow from this:
- Retargeting only works on an audience you have built. Awareness spend on Meta feeds the audiences that search and retargeting later close. Cutting the top of the funnel to lift this month’s ROAS often costs you next quarter’s sales.
- Retention is usually the cheapest revenue you have. A figure from RetentionGrid data reported by Ecommerce Times put average LTV for email-acquired customers at $562 against $312 for Meta-acquired ones. It is one vendor’s dataset, so use it as direction rather than a forecast for your store, but it shows why email and SMS belong in the plan from the start.
On the paid side, the split between platforms is its own decision. Our comparison of Meta Ads versus Google Ads works through where an extra $50K tends to go, and our guide to a Facebook Ads budget for ecommerce covers scaling on Meta.
A peer-reviewed study of retail media gives a useful hint about stage as well. In an analysis of 122,000 Amazon brands in the Journal of Marketing Analytics, small brands benefited most from upper-funnel ad formats, while medium and large brands benefited most from lower-funnel formats. The setting is Amazon retail media, not your own site, but the direction matches the maturity logic above.
Build the budget in six steps
- Fix your revenue and margin numbers. Use net sales and a contribution margin that includes shipping, fees and returns.
- Set a profit target. Decide what share of revenue must remain after marketing. This gives your ceiling, as in the example above.
- Calculate break-even ROAS and MER. These are your floor for efficiency.
- Check LTV:CAC by channel. If you lack cohort data, use a conservative LTV, such as 6 or 12 months of gross profit per customer.
- Pick a starting percentage from the benchmark range for your stage, then check it against the ceiling. If the benchmark exceeds the ceiling, the ceiling wins.
- Divide the total by funnel stage and channel, and reserve a slice, many brands use around 10%, to test new channels or creative. The size of that slice is a judgment call, not a standard.
The common error is working top-down from a competitor’s rumored percentage. The numbers that matter are your own.
Measure what the budget actually produces
Platform-reported ROAS tends to credit ads with sales that would have happened anyway, and different platforms can claim the same order. For budget decisions, use a blended view.
Karbon Analytics suggests this rhythm:
- Weekly: MER or blended ROAS trend, blended CAC, new versus returning revenue, average order value, performance by channel, and conversion rate by device and source.
- Monthly: contribution margin overall and by channel, LTV and LTV:CAC, cohort retention and repeat-purchase rate, profit, and channel mix shift.
The same source notes that a MER sliding from 4.2 to 3.6 over three weeks is a real signal, while day-to-day bounces are noise. Pre-define the CAC or MER level that triggers reallocation, so you are not debating it mid-month. Review the full allocation at least quarterly, since budgets fixed in January are rarely right by the autumn.
For large moves, test incrementality: the causal effect of marketing compared with what would have happened without it. The IAB’s guidelines for incremental measurement advise stronger causal methods, such as experiments, for high-stakes decisions like budget allocation, and lighter proxies for quick tactical tuning. A practical walkthrough of running an incrementality test shows how to set up a holdout and read the lift.
Our perspective
Most budget conversations we hear start with a percentage and end with a channel. We think they should start with margin and end with a profit target.
The percentage tells you what similar companies spend. It does not tell you what your product, your repeat rate and your cash position can support. A budget built from contribution margin, CAC and LTV gives you a ceiling you can defend and a floor you can measure against.
The second mistake is treating acquisition as the whole budget. Our approach at Rozee Digital, the Ecommerce Acceleration System™, covers acquisition, conversion and retention together, because a dollar spent improving conversion or lifting repeat purchase makes every acquisition dollar work harder. Spending on traffic alone leaves that return on the table.
Finally, we keep client rosters deliberately small and have senior strategists lead the work, so the budget is revisited with someone who knows the numbers, not set once and left.
Tom
Where Rozee Digital fits
If your brand is established on Shopify, WooCommerce or Magento, and your CAC is rising or your retention is flat, the budget question is rarely just “how much.” It is how to divide spend between finding customers, converting them and bringing them back.
Rozee Digital manages paid search and paid social, and handles Klaviyo setup and optimization for retention, all under one framework focused on profitable growth. Senior strategists lead the work, and we keep our client list small. Pricing is not published; talk to us at rozeedigital.com about your numbers.

FAQ
What percentage of revenue should an ecommerce business spend on marketing?
Most benchmarks fall between roughly 7% and 15% for established brands, and higher for early-stage ones. The 2026 CMO Survey figures, as summarized by Anlyto, put B2C product companies near 12%. Use the range as a start, then test it against your contribution margin and LTV:CAC.
How much should a new ecommerce brand spend?
New brands usually spend a larger share of revenue because they have little repeat business. CFO Expertise puts startups under $1M at 20% to 30%. That only makes sense if the margin supports it and you can track payback on each customer.
How often should I review my marketing budget?
Watch MER and CAC weekly, check contribution margin and LTV monthly, and reallocate across channels at least quarterly. Set the trigger level in advance, such as the CAC at which you move spend.
Is ROAS enough to judge whether the budget is working?
No. ROAS comes from the ad platform and ignores margin and returning customers. Pair it with MER, blended CAC and contribution margin, and test incrementality before large shifts in spend.
Sources
- Ecommerce Marketing Budget Percentage of Revenue (Anlyto)
- Ecommerce marketing budget: Plan for success (Hostinger)
- How to Set an Ecommerce Marketing Budget That Converts (CFO Expertise)
- How to Set Up Triple Whale for a Shopify DTC Brand
- Ecommerce Marketing Spend 2026: Benchmarks by Revenue
- How to Map a Full-Funnel Paid Media Strategy (Modern Marketing Institute)
- Customer LTV-First Marketing Cuts E-Commerce CAC (Ecommerce Times)
- Data-driven budget allocation of retail media (Journal of Marketing Analytics)
- Ecommerce Manager KPIs: Daily, Weekly & Monthly (Karbon Analytics)
- Guidelines for Incremental Measurement in Commerce Media (IAB)
- Incrementality Testing in Marketing
- Content Marketing for Ecommerce