DTC conversion optimization is the work of getting more of your existing visitors to buy, so every ad dollar, email and organic visit returns more profit. The reliable order is simple: measure conversion against a clear denominator, fix the points where paid traffic leaks (landing page, product page, checkout), test one change at a time, and judge every result against margin, not just conversion rate. This guide walks through that sequence for established ecommerce brands.
TL;DR
- Conversion rate is conversions divided by visits, times 100. Pick one denominator (sessions is the usual choice) and keep it constant.
- Raising conversion rate lowers your effective customer acquisition cost (CAC) on every channel at once, which is why it is the cheapest lever for profitable growth.
- The biggest leaks tend to sit after the click: slow mobile pages, weak product pages, surprise costs and forced account creation at checkout.
- Test with a hypothesis, a fixed run time and a profit metric. A higher conversion rate that comes from discounting can still lose money.
- Retention and lifetime value (LTV) decide how much CAC you can afford, so conversion work should not stop at the first order.
Table of Contents
- What conversion rate means for a DTC brand
- The metrics that keep conversion work honest
- Why conversion is the cheapest way to lower CAC
- Fixing the journey from ad click to checkout
- How to run A/B tests you can trust
- Common mistakes that undermine conversion work
- Connecting conversion to retention and LTV
- Our perspective
- Where Rozee Digital fits
- FAQ
- Sources
What conversion rate means for a DTC brand
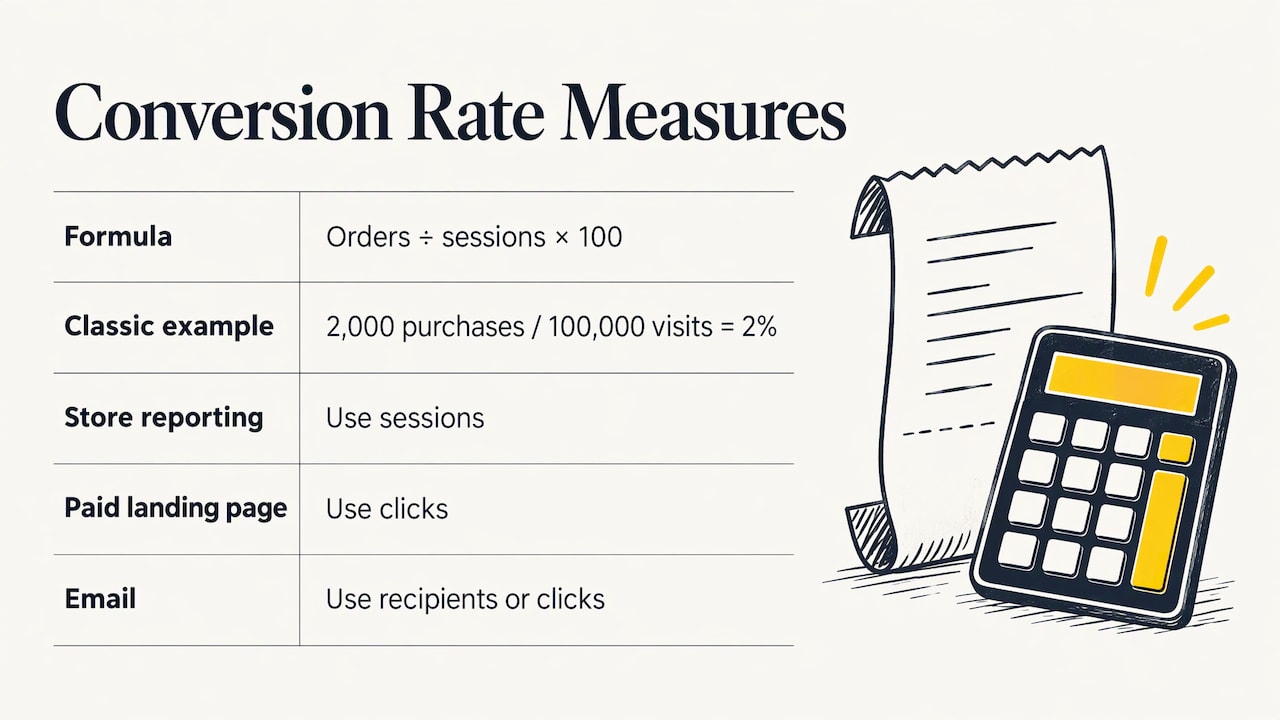
Conversion rate is the percentage of users who take a desired action. Nielsen Norman Group gives the classic ecommerce case: a site visited by 100,000 people in April with 2,000 purchases has a 2% conversion rate.
For a DTC brand the desired action is usually a completed purchase. The formula is:
Conversion rate = (orders ÷ sessions) × 100
The denominator is where teams get into trouble. Stripe describes ecommerce conversion rate as the share of site visits that resulted in an order in a given period. Shopify’s own explanation separates a visit-based rate from a user-based rate: the visit-based version is the standard for benchmarks, while the user-based version accounts for customers who come back several times before buying.
A practical rule: use sessions for store-level reporting, clicks for a specific paid landing page, and recipients or clicks for email. Do not mix them under one label, or two reports will disagree and nobody will know why.
Secondary conversions worth tracking
The purchase is the primary conversion, but the steps before it tell you where to look. Add-to-cart rate, checkout initiation rate, and email or SMS signup rate each show a different stage of intent. If add-to-cart is healthy but checkout completion is weak, the product page is not your problem.
The metrics that keep conversion work honest
Conversion rate alone can mislead. A brand can double it by discounting everything and lose money on each order. Pair it with the following, all defined plainly:
| Metric | What it means | How it is calculated |
|---|---|---|
| Conversion rate (CVR) | Share of sessions that end in an order | Orders ÷ sessions × 100 |
| Average order value (AOV) | Revenue per order | Revenue ÷ orders |
| CAC | What it costs to win a new customer | Total sales and marketing spend ÷ new customers acquired |
| ROAS | Revenue the platform attributes to ad spend | Ad-attributed revenue ÷ ad spend |
| MER | Blended efficiency across all channels | Total revenue ÷ total marketing spend |
| LTV | Revenue a customer generates over their relationship with you | AOV × purchase frequency × average customer lifespan |
| Contribution margin | Profit per order after variable costs | Revenue minus COGS, shipping, payment fees and variable ad spend |
ROAS comes from the ad platform and depends on its attribution. MER ignores attribution and asks whether total revenue justifies total marketing spend, which makes it the better check when channels overlap. Our deeper breakdown of DTC marketing metrics covers how to read them together.
Contribution margin deserves special attention. One DTC KPI framework argues it is the most underused DTC metric, and that if blended CAC creeps above contribution margin per order, you are paying more to acquire a customer than that first order earns. That is not always a problem, since repeat purchases can pay it back, but you should know it is happening.
What benchmarks can and cannot tell you
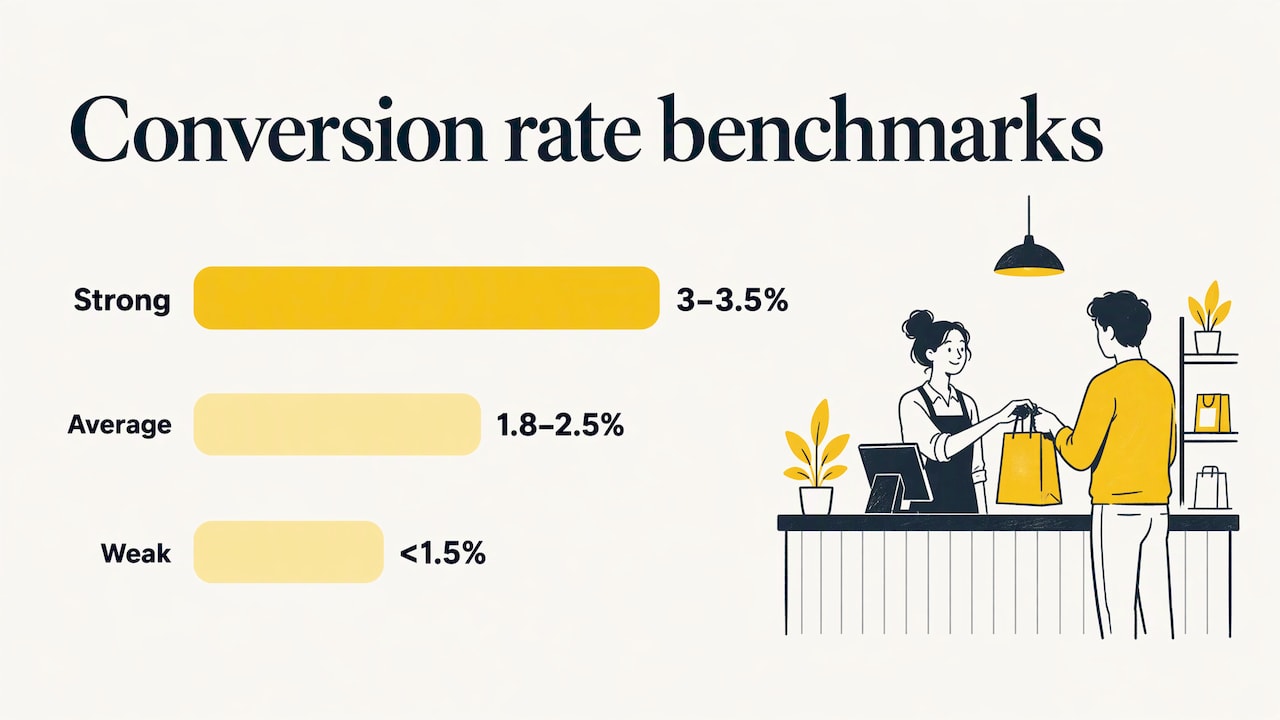
Benchmarks vary by source and category. One 2026 Shopify-brand KPI guide puts a strong conversion rate at 3 to 3.5%, an average of 1.8 to 2.5%, and a weak one below 1.5%. Use these as a rough orientation only. Your own trend line, split by device and traffic source, is a far better yardstick than an industry average.
Why conversion is the cheapest way to lower CAC
A Boston Consulting Group and Shopify study of more than 220,000 ecommerce sites found that a one percentage point lower-funnel conversion improvement could generate an incremental $6 million a year for an illustrative store with about $100 million in revenue. The authors frame conversion optimization as a cost-neutral way to lift margins.
The logic is easy to see with a hypothetical example. The numbers below are invented for illustration, not a client result.
| Before | After a 20% conversion lift | |
|---|---|---|
| Monthly sessions | 40,000 | 40,000 |
| Conversion rate | 2.0% | 2.4% |
| Orders | 800 | 960 |
| AOV | $80 | $80 |
| Revenue | $64,000 | $76,800 |
| Ad spend | $20,000 | $20,000 |
| CAC (assuming all orders are new customers) | $25.00 | $20.83 |
| MER | 3.2 | 3.84 |
Same traffic, same spend, 17% lower CAC. You did not need a bigger budget or cheaper clicks. That is why conversion work compounds every acquisition channel, and why it belongs next to paid media planning, not after it.
There is a flip side. The same BCG research notes that traffic and conversion rate often move in opposite directions, and so do AOV and conversion rate. When you scale spend, expect conversion rate to soften as colder audiences arrive. Judge conversion changes by cohort and by channel, not only by the blended number.
Fixing the journey from ad click to checkout
Paid traffic has the least patience. Someone clicked a 15-second video or a static ad, and the page now has to continue the same story. Walk the journey in four stages.
1. The landing page must match the ad
The headline, product and offer in the ad should appear immediately on the page, above the fold on a phone. If the ad promised a specific bundle and the page opens on a generic collection grid, you have created friction before the visitor sees a price. Dedicated conversion-focused landing pages for your highest-spend campaigns usually beat sending all traffic to the homepage or a default collection.
2. Speed and mobile usability
Mobile is where paid social traffic mostly lands, and speed is a conversion factor. Google’s Milliseconds Make Millions study found that even a 0.1 second improvement in mobile load metrics improved progression through the purchase funnel, with positive effects on conversion rate and AOV. Compress images, trim third-party scripts and review your app stack before you redesign anything.
Clear layouts, thumb-friendly buttons and readable forms matter just as much. These UX and UI best practices are a good checklist for the on-site fundamentals.
3. Product pages that answer the buying question
A product page has one job: remove the doubts that stop a purchase. Check that it covers:
- Large, varied imagery, including the product in use and at scale
- Price, shipping cost and delivery estimate without scrolling
- Reviews and other social proof near the add-to-cart button
- Plain answers on sizing, ingredients, materials, returns and guarantees you actually offer
- A bundle or add-on suggestion where products genuinely go together
Bundles and cross-sells are one of the more dependable AOV levers, but they should come from real co-purchase data, not guesses. Our guide to Shopify conversion strategies goes deeper on page-level changes.
4. A checkout with nothing to be surprised by
Checkout is where intent either completes or evaporates. Baymard Institute’s research on cart abandonment reports that 40% of users abandoned a checkout because of additional costs such as shipping, taxes and fees, and that 18% abandon when forced to create an account. Both are fixable without touching your creative:
- Show shipping and tax estimates early, ideally on the product or cart page
- Offer guest checkout and invite account creation after the order
- Use express payment options for returning shoppers
- Keep forms short and show an order summary throughout
A 2026 benchmark guide cites a typical cart abandonment rate around 70%, so assume most carts will not convert and focus on the avoidable share. Cart and browse recovery flows in email and SMS pick up some of the rest, which is where Klaviyo setup and optimization connects directly to conversion.
How to run A/B tests you can trust
Testing is how you separate a real lift from noise. The BCG and Shopify team recommends continuously running robust A/B tests across everything from core experience flows to merchandising, because every ecommerce experience is unique. A workable routine looks like this:
- Find the biggest leak. Use your funnel: sessions to product view, product view to cart, cart to checkout, checkout to order. Test where the drop is largest and traffic is highest.
- Write a hypothesis. “Showing shipping cost on the product page will reduce checkout abandonment because shoppers dislike late surprises” is testable. “Make the page better” is not.
- Change one thing. Or one tightly related set of things, so you know what caused the result.
- Choose the measurement period before you start. Nielsen Norman Group’s advice on choosing a period is to make it long enough to avoid random fluctuations yet short enough to track across several periods and make a business impact. In practice, run the test through full weekly cycles and do not stop the moment it looks good.
- Judge on profit. Look at conversion rate, AOV and contribution margin per session. A variant that wins on conversion by discounting may lose on margin.
- Log everything. Wins, losses and flat results all inform the next hypothesis.
Low-traffic stores should be realistic. If a test needs months to reach a trustworthy result, test bigger changes (offer, page structure, pricing presentation) rather than button colors. For a longer treatment, see our profit-first guide to ecommerce A/B testing and our piece on A/B testing in DTC advertising, which covers creative and audience tests that feed the page.
Common mistakes that undermine conversion work
- Optimizing the blended rate only. Mobile and desktop behave very differently, and so do paid and organic visitors. BCG found organic channels hold a clear edge over paid in overall conversion rate, so a rising paid share will pull the blended number down even when nothing is broken.
- Stopping tests early. Early leads often shrink. Commit to the run time first.
- Buying conversions with discounts. If AOV stays flat while ad spend climbs, the funnel may be leaning on promotions rather than demand. Track margin alongside conversion.
- Treating CRO as a one-off redesign. Customers, traffic mix and seasons change. Keep a standing test backlog.
- Ignoring what happens after the first order. A brand with strong repeat purchasing can afford a higher CAC, so a modest first-order conversion rate is not automatically a problem.
- Mixing denominators. Comparing a session-based rate to a visitor-based benchmark makes your own number look better or worse than it is.
Connecting conversion to retention and LTV
Conversion does not end at the order confirmation page. Profitability comes down to two levers: raising LTV and lowering CAC. Social Media Examiner illustrates the retention side with a simple subscription example: at 80% monthly retention, a $47 a month subscription has an LTV of roughly $235, and at 90% retention it roughly doubles.
For a DTC brand, the same idea shows up in repeat purchase rate, which Shopify defines as repeat customers divided by total customers, times 100. Post-purchase flows, replenishment reminders, and email and SMS programs raise that number. Higher repeat rates mean you can pay more to acquire the first order and still land inside a healthy LTV to CAC ratio. This is also why we see conversion, creative and retention as one system, not three separate workstreams.
Our perspective
Most brands come to us asking for cheaper traffic. More often, the answer sits after the click. If a store converts at 2% and a focused round of landing page, product page and checkout work moves it to 2.4%, every channel gets cheaper at once.
We would rather improve what you already pay for than ask you to spend more. That means starting from contribution margin, not vanity conversion numbers, and testing in an order that reflects where your funnel loses the most money.
It also means joining the dots. The ad promise, the landing page, the offer and the post-purchase email should read like one conversation. That is the thinking behind our Ecommerce Acceleration System™, which treats acquisition, conversion and retention together, and why senior strategists lead the work for a deliberately small roster of brands.
Tom
Where Rozee Digital fits
If your paid media is running but profit is not scaling with it, the gap is often between the click and the order. Rozee Digital works with established Shopify, WooCommerce and Magento brands on paid media, creative, conversion-focused landing pages and Email & SMS, all aimed at profitable growth rather than platform-reported vanity numbers.
If you want senior-level eyes on your funnel, talk to Rozee Digital about where your acquisition, conversion and retention are leaking margin. For acquisition specifically, see our paid social campaign management and paid search services. You can also read our wider conversion rate optimization strategies for more tactics.
FAQ
What is a good conversion rate for a DTC brand?
It depends on category, price point and traffic mix. One 2026 Shopify-brand KPI guide treats 1.8 to 2.5% as average and 3% or more as strong, but those are only reference points. Compare yourself to your own trend, split by device and channel, and focus on the stage of the funnel with the biggest drop.
How long should a DTC A/B test run?
Long enough to cover full weekly cycles and avoid random fluctuation, and short enough that you can run several tests a quarter. Set the run time and success metric before launching, and do not stop early because a variant looks ahead. Low-traffic stores should test larger changes so results arrive in a reasonable time.
Does improving conversion rate lower CAC?
Yes, when traffic and spend stay the same. CAC is spend divided by new customers, so more orders from the same visitors means a lower cost per customer. Check that the lift is not coming from heavier discounting, which can offset the gain in contribution margin.
Should I fix conversion before scaling ad spend?
Usually the two run in parallel. Fix obvious leaks first, such as slow mobile pages, hidden shipping costs and forced account creation, then scale spend while you keep testing. Expect conversion rate to soften slightly as you reach colder audiences, and measure by channel.
Sources
- Conversion Rate: Definition as used in UX and web analytics (Nielsen Norman Group)
- Calculate Conversion Rate: Formula and Tips (Shopify)
- Ecommerce Conversion Rate Optimization Strategies (Stripe)
- Ecommerce KPIs: Metrics to Track in 2026 (Shopify)
- What Metrics Should DTC Brands Track? (Trivas)
- Ecommerce KPIs: The 15 Metrics Every Shopify Brand Must Track (Polar Analytics)
- Leading Online Shoppers to the Finish Line (BCG and Shopify)
- Milliseconds Make Millions (web.dev)
- How to Reduce Cart Abandonment (Baymard Institute)
- Improving Customer Experience: How to Increase Revenue and Profitability (Social Media Examiner)
- 10 UX/UI Best Practices for Modern Digital Products (devPulse)